A Reliability Block Diagram (RBD) is a graphical representation used in reliability engineering and system analysis to model the reliability of complex systems.
The basic symbols used in a Reliability Block Diagram include:
Block: Representing the components or subsystems.
Series Connection (AND gate): Shown as a line connecting blocks in series. The system fails if any of the connected components fail.
Parallel Connection (OR gate): Shown as lines converging to a point. The fails if all the connected components fail.
Example
Determine the pump set reliability where the centrifugal pump reliability is 0.85 and the electrical motor is 0.85.
Determine the reliability of the pumping operation where the operating mode is 2×100% (1 run and 1 stand-by)
Challenging of RBD
Simplification Assumption: RBDs often rely on simplifying assumptions, such as assuming components are statistically independent or that failure rates remain constant over time.
Limited to Static Systems: RBDs are most suitable for static systems where the reliability of components remains constant over time. They may not be as effective for dynamic systems with changing conditions or where the reliability of components is influenced by external factors. That means RBD is not able to capture the time-dependent behavior of components, such as wear and aging.
Complexity for Large System: As the size of the system increases, creating and analyzing an RBD can become complex.
Limited in Representing Common-Cause Failures: RBDs may not be the most suitable tool for representing and analyzing common-cause failures, where multiple components fail simultaneously due to a shared cause.
Reliability Data
Standard failure data is available from such as:
OREDA – Offshore Reliability Data
RAC – Reliability Analysis Centre
Process Equipment Reliability Data AICH
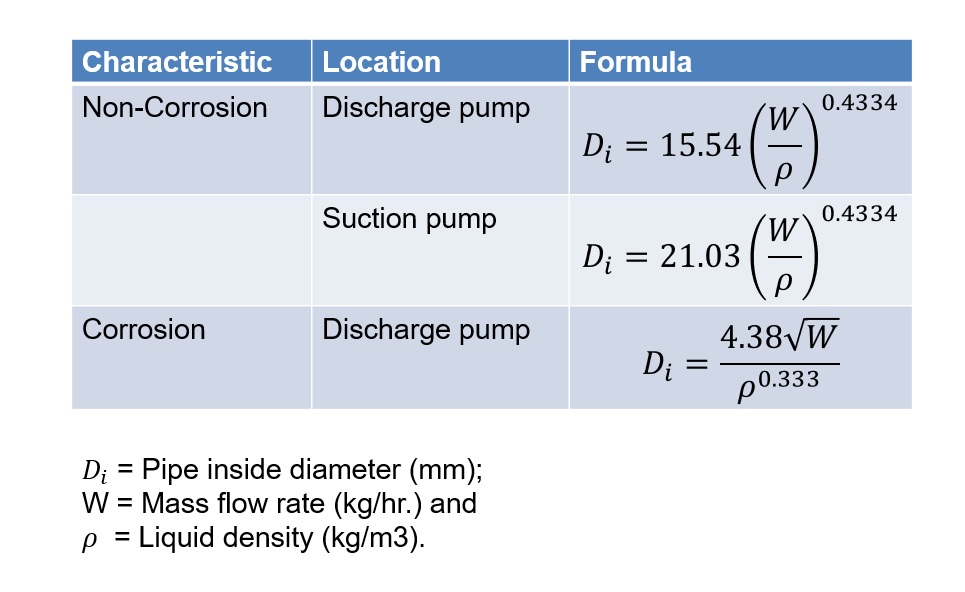
Reliability Formula
The below table expresses the reliability formula.
Code & Standard
IEC-61078: Analysis Techniques for dependability – Reliablity Block Diagram and boolean methods.
The term Probability of Failure on Demand (PFD) is commonly used in the context of Safety Instrumented System (SIS). It is a measure of the reliability of a Safety Instrumented Function (SIF) and represents the likelihood that the system will fail to perform its intended safety function when demanded.
The PFD is expressed as a probability ranging from 0 to 1, where a lower value indicates higher reliability. A PFD of 0 means the system is perfectly reliable, while a PFD of 1 signifies complete failure.
To calculate the PFD, it is mandatory to consider the failure rates of individual components within the Safety Instrumented System. This includes sensors, logic solvers, and final elements (e.g. valves or actuators). The PFD is determined based on the architecture of the safety system and the redundancy implemented to achieve the required level of reliability.
Anyhow, the PFD is just one metric in the overall assessment of safety instrumented systems. Other factors, such as architecture constraints, and systematic capability.
The calculation of the Probability of Failure on Demand (PFD) is guided by industry standards and codes related to function safety such as IEC 61508, IEC 61511, and ANSI/ISA-TR84.00.02
SIL requirements according to ISA-TR84.00.02 and IEC/EN 61508
SIL according to ISA-TR84.00.02
SIL
Demand mode of operation (probability of failure on demand average)
3
< 10-3 to > 10-4
2
< 10-2 to > 10-3
1
< 10-1 to > 10-2
SIL according to IEC/EN 61508
SIL
Low Demand (Average probability of failure on demand)
High Demand or Continuous Mode of operation (Probability of dangerous failure per hour)
4
<10-4 to >10-5
< 10-8 to > 10-9
3
<10-3 to >10-4
< 10-7 to > 10-8
2
<10-2 to >10-3
< 10-6 to > 10-7
1
<10-1 to >10-2
< 10-5 to > 10-6
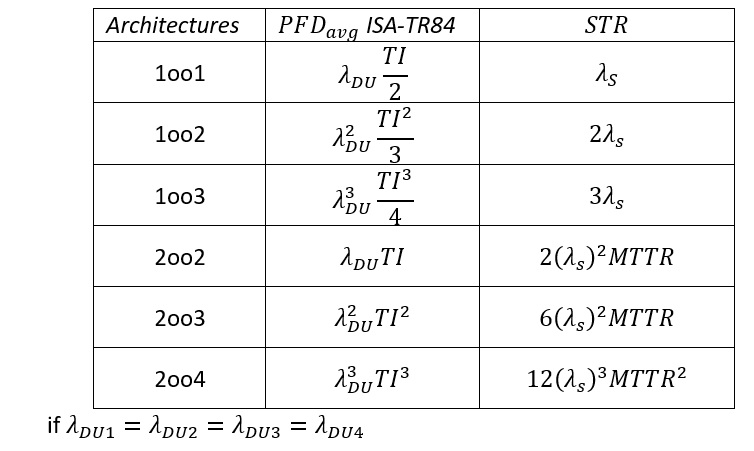
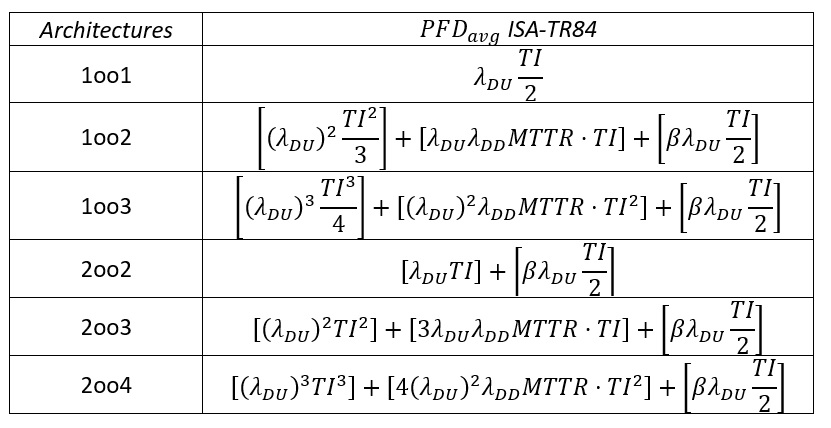
Probability of Failure on Demand average (PFDavg) ISA-TR84.00.02
The simplified equation without the terms for multiple failures during repair, common cause, and systematic errors are as follows.
When considering the common-cause failure and MTTR are as follows.
Probability of Failure on Demand average (PFDavg) IEC 61508
In functional safety engineering, the failure rate is a key parameter in determining the probability of a system failing to perform its safety functions when needed.
In the context of reliability engineering, it is also aimed to understand and manage the reliability of a system and components, ensuring that they perform their intended functions without failure over a specific time period. Hence, the failure rate is a crucial metric in assessing and predicting the reliability of a system.
Hence, in the context of both functional safety engineering and reliability engineering, the failure rate refers to the frequency at which a system, component, or device fails during specific period of operation. It is often expressed as the number of failures per unit of time, such as failures per hour or failures per million hours of operation (FIT).
Example-1
Determine the failure of a new installation proximity switch in the green field project over the first operation month. Below is the record data.
Failure Rate Characteristics
The “bath curve” is a concept often used in reliability engineering to describe the failure rate characteristics of a product or system over its lifecycle where the bath curve consists of three distinct phases:
Infant Mortality Phase (Early Life Failure): In the initial phase, there is a higher likelihood of failures. Failures during these periods are often due to manufacturing defects, design flaws, improper installation, and commissioning.
Normal Life Phase: Following the infant mortality phase, there is a period where the failure rate remains relatively constant. This is often referred to as the “Normal life”.
Wear-Out Phase: As the product approaches the end of its expected life, there is an increase in the failure rate. This is because components may degrade, or wear out.
Relation of Failure Rate and Reliability
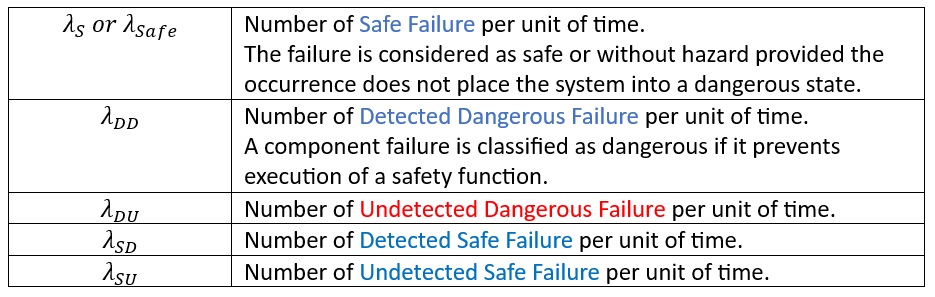
Type of Failure
Failures are separated into two significant categories which are Safe and Dangerous.
Safe Failure refers to the failures that lead the system into a safe state, preventing or mitigating the risk of a hazardous event.
Dangerous Failure refers to the failures that could potentially lead to a hazardous condition if the system does not respond appropriately.
Example-3
Below is the example failure mode of a transmitter with provision low-trip function.
Instrument Failure Mode
SIF Failure Mode
Frozen output
Fail-Danger
Output to upper limit
Fail-Danger
Output to lower limit
Fail-Safe
Diagnostic failure
Annunciation
Safe Failure Fraction (SFF)
The Safe Failure Fraction (SFF) is a measure of the fraction of a system’s failures that result in a safe state or do not lead to dangerous or hazardous conditions. The Safe Failure Fraction is expressed as the following formula.
Failure Mode and Effect Analysis or FMEA is a systematic method used in some industries such as manufacturing, automation, aerospace, etc to evaluate and prioritize the potential of failure modes in a process, product, or system and their potential impact on performance.
The primary goal of FMEA is to identify and address potential problems before they occur, with the ultimate aim of improving reliability and preventing failures.
The FMEA workflow
Identifying Components and Functions: List all components or processes involved in the system, and identify their functions.
Identifying Failure Mode: For each component or process, identify potential failure modes (Ways in which the component or process could fail to perform its intended function)
Identify the Potential Cause: The team brainstorms and lists the potential cause or scenario associated with the equipment, system, or process.
Identify the Potential Effect: The team identifies the potential effect of each identified cause. The potential effect may be within or over the equipment/system.
Determine the recommendation: The team evaluates the gap or the further recommendation that be implemented.
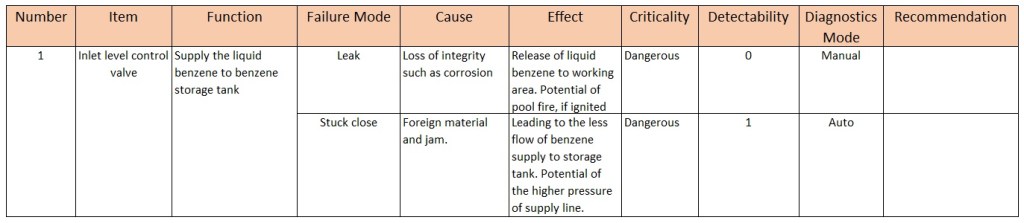
FMEA Study Worksheet
Example of equipment where FMEA is commonly used
Automotive industry:
Engine system
Transmission system
Braking system
Electronic Control Unit (ECU)
Aerospace Industry
Aircraft engines
Flight control system
Hydraulic system
Railway System
Locomotive
Signaling system
Brake system
Electronics and Telecommunication
Telecommunication network
Printed Circuit Boards (PCBs)
Electronic Control System
Power supply
FMEA Standards
MIL-STD 1629: Procedures for performing a failure mode and effect analysis
IEC 60812: Procedure for failure mode and effect analysis (FMEA)
SAE ARP 5580: Recommended failure modes and effects analysis (FMEA) practices for non-automobile applications
FMEA Extensions to FMECA and FMEDA
FMECA or Failure Mode, Effects, and Criticality Analysis: FMECA extends the traditional FMEA by incorporating criticality analysis. Criticality refers to the assessment of the consequences of a failure, taking into account the probability of occurrence and the ability to detect the failure before it leads to severe consequences.
FMEDA or Failure Mode, Effects, and Diagnostic Analysis: FMEDA is a specialized form of analysis commonly used in the context of safety-critical systems. It includes an evaluation of the diagnostic ability of any automatic online diagnostic or manual proof test.
Failure Mode, Effects, and Criticality Analysis (FMECA)
Additional working steps from the FMEA need to be done.
Assessing Severity (S): Evaluate the potential consequences or impact of each failure mode on the overall system. Assign a severity rating based on the potential harm or consequences.
Assessing Occurrence (O): Estimate the likelihood or frequency of each failure mode occurring. Assign an occurrence rating based on historical data, experience, or expert judgment.
Assessing Detection (D): Evaluate the likelihood or potential of detecting each failure mode before it causes harm or damage. Assign a detection rating based on the effectiveness of existing detection methods or systems.
Calculating Risk Priority Number (RPN): Multiply the severity, occurrence, and detection ratings to calculate a Risk Priority Number (RPN) for each failure mode. This helps prioritize which failure modes to address first.
Prioritizing Actions: Focus on addressing the high-risk failure modes with the highest RPN values. Develop and implement corrective actions to reduce the likelihood of occurrence, improve detection, or mitigate the severity of consequence.
FMECA Standards
BS 5760-5: Guide to failure modes, effects, and criticality analysis (FMEA and FMECA)
Failure Mode, Effects, and Diagnostic Analysis (FMEDA)
The results of detectability are emphasized in the column Detectability and Diagnostic Mode with a number 1 to designate that this failure is detectable and a number 0 if the failure is not detectable.
The What-If analysis technique is a brainstorming approach conducted by a group of experienced person and familiar with the subject process. However, What-If Analysis is not as inherently structured as HAZOP Analysis and FMEA analysis.
The What-If analysis technique is the same as the HAZOP technique which allows experts to use their experience more creatively. Both technique offers a different way for the question to be focused. The HAZOP used “HAZOP guidewords” such as “No”, “More”, etc mix with process parameters “Flow”, Temperature”, etc. This is called “Process Deviation”. But What-If techniques use “What-If” to question the participant.
This technique is creatively processed and it is more likely to uncover unique or unexpected hazards in processes. However, unless the team leader is highly skilled and the team members have appropriate experience, critical and important hazards may be overlooked.
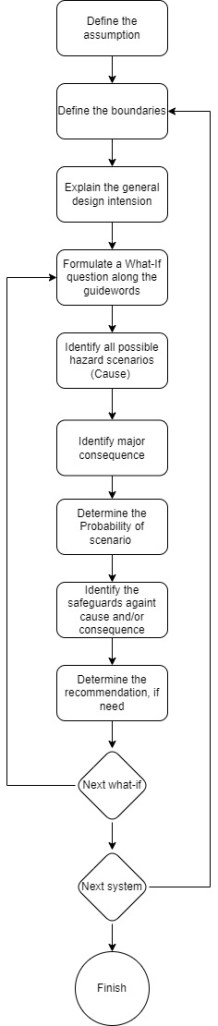
What-If Analysis Workflow
Below is the What-If Analysis working flowchart.
Example of What-If Worksheet
What If
Hazard
Consequence
Safeguards
Recommendation
Piping leakage
Potential of fire, if ignited, and asset damages.
Potential of fire, if ignited and asset damages.
Hazard Area Classification, Gas Detector
Blockage of suction strainer
Loss of liquid flow through the pump
The potential of pump cavitation and damages
Differential pressure across the suction strainer
Pump trips
Loss of liquid flow supply to the column
The potential cause of low liquid level in the column
The standby pump
Challenges of What-If Analysis
Assumption Dependency: Results from What-If analysis heavily depend on the accuracy of the assumptions and input values. If these assumptions are flawed, the analysis may provide misleading results.
Complexity: In some cases, the models used for What-If analysis can be complex. requiring specialized knowledge and expertise to develop and interpret the results.
Limited Prediction: While What-If analysis is useful for exploring potential outcomes, it may not provide precise predictions, especially in complex and dynamic environments.
Overlook Unforeseen Factors: What-If analysis is based on known variables and assumptions. It may not account for unforeseen factors or external events that could significantly impact the outcomes.
Preliminary Hazard Analysis (PrHA) is typically conducted at the early stages of the project or system development when plant location and layout are being considered, often during the R&D stage, Feasibility Study (F/S), or conceptual design phase. This allows for the identification of potential hazards before they become more difficult and costly to address.
Preliminary Hazard Analysis (PrHA) is normally used on new facilities to get an overview but not a detailed view of process operation.
Workflow of the Preliminary Hazard Analysis
The workflow of PrHA is to prepare the study, subdivide the process, identify process hazards, list the credible causes, specify the consequence, assign the criticality ranking, and identify the recommendation.
Liquid line sizing is the process of determining the appropriate diameter and thickness of a pipeline that is used to transport liquids from one location to another.
Liquid line sizing is a critical aspect of process engineering design, as it ensures that the correct amount of fluid can be transported safely and efficiently through a pipeline.
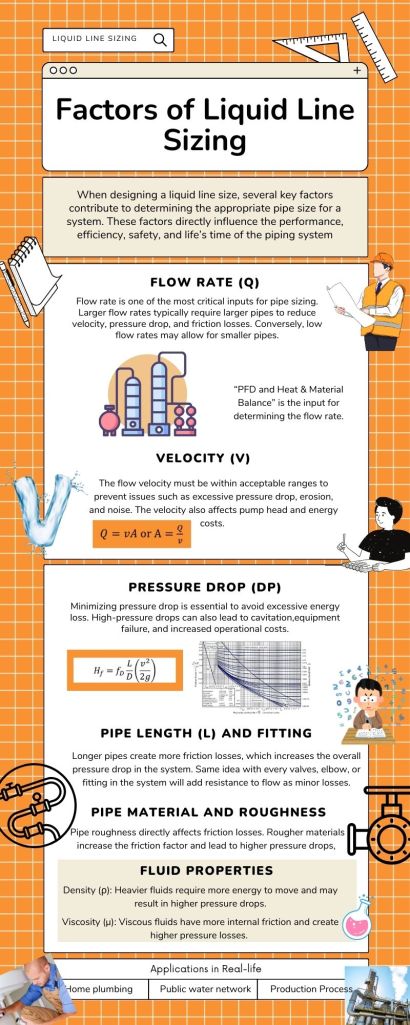
The design of liquid pipelines is based on several factors, including the flow rate of the liquid, the pressure drop, the viscosity of the liquid, the density of the liquid, the pipe material and thickness, and the elevation changes in the pipeline. All of these factors must be taken into account when designing a liquid pipeline system.
To size a liquid pipeline, you must first determine the required flow rate of the liquid. This can be done using various methods, including mass flow rate, volumetric flow rate, and velocity. Once the required flow rate is determined, you can then use various calculations to determine the appropriate pipe diameter and thickness to minimize pressure drop.
The pressure drop in a liquid pipeline is a critical factor that must be carefully managed. Too much pressure drop can cause excessive friction and reduce the flow rate, while too little pressure drop can cause the liquid to flow too quickly, which can cause damage to the pipeline. You must also take into account the effects of fittings, valves, and other components that can affect the pressure drop in the system.
Flow rate: The rate at which liquid flows through a pipeline, expressed in terms of volumetric flow rate such as cubic meter per hour;
Velocity: The speed at which the liquid flows through the pipeline, expressed in terms of meters per second;
Pressure drop: The decrease in pressure that occurs as the liquid flows through the pipeline due to frictional losses, changes in elevation, and other factor;
Density: The mass of a liquid per unit volume, expressed in terms of kilograms per cubic meter.
Viscosity: The resistance of a liquid to flow, which is determined by its molecular structure and temperature.
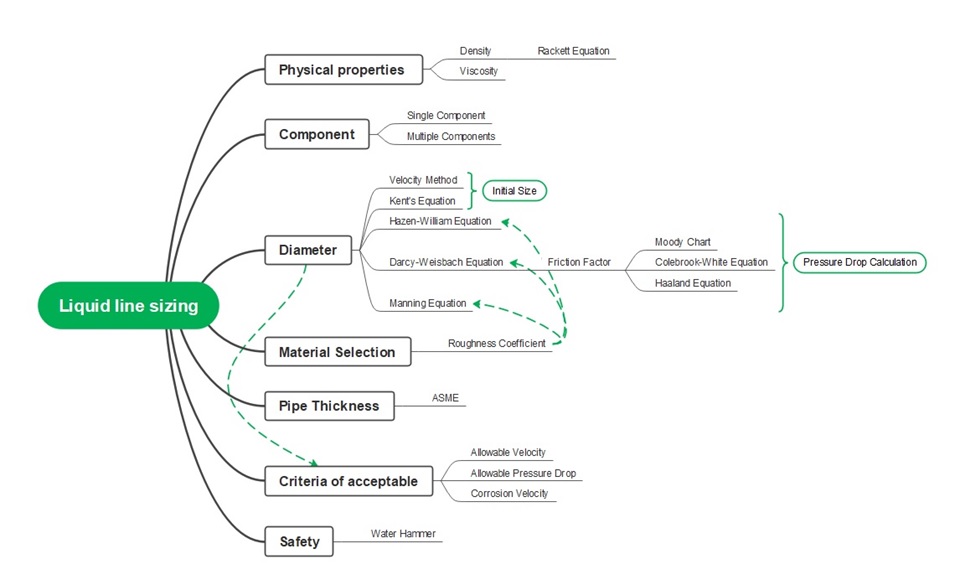
Pipe Sizing Calculation Formula and Application
Several methods are used to calculate the appropriate size of a pipe for a given flow rate and pressure drop. Here are some of the most common pipe-sizing calculation methods:
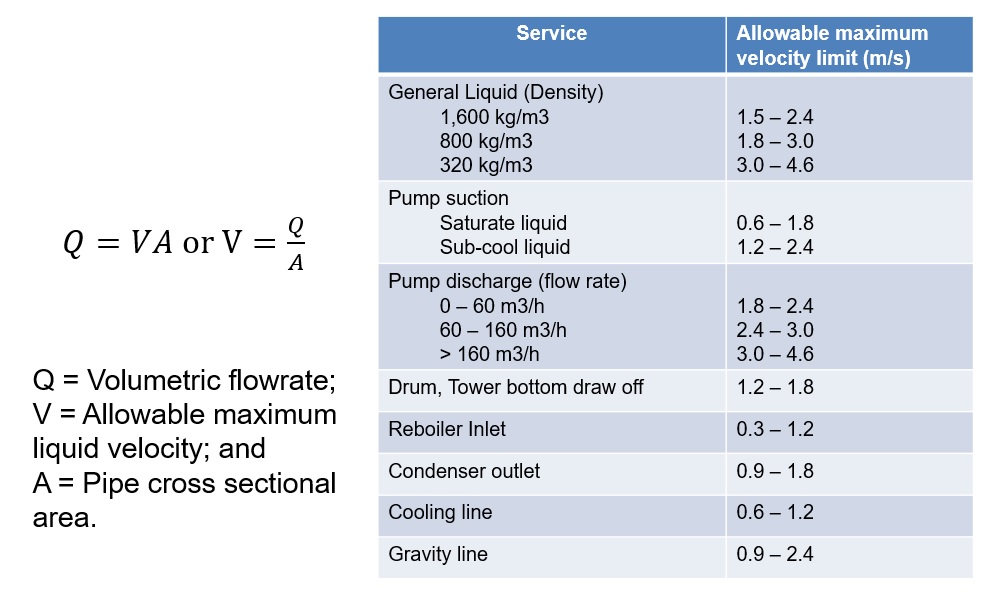
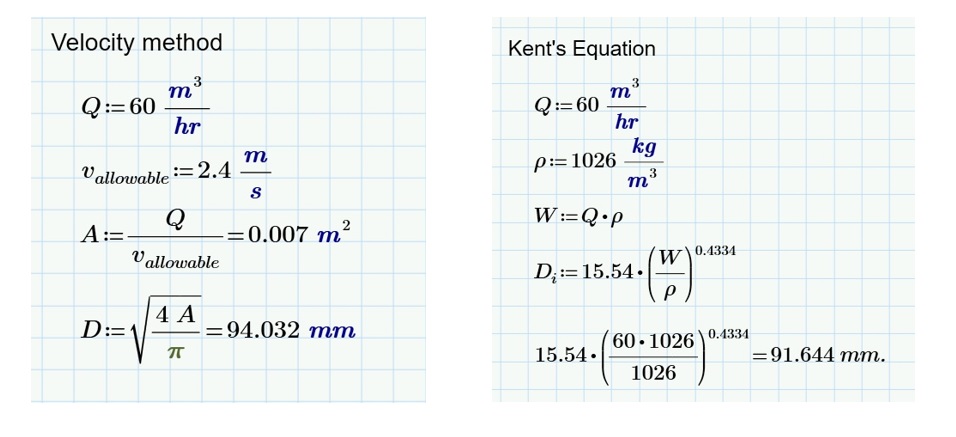
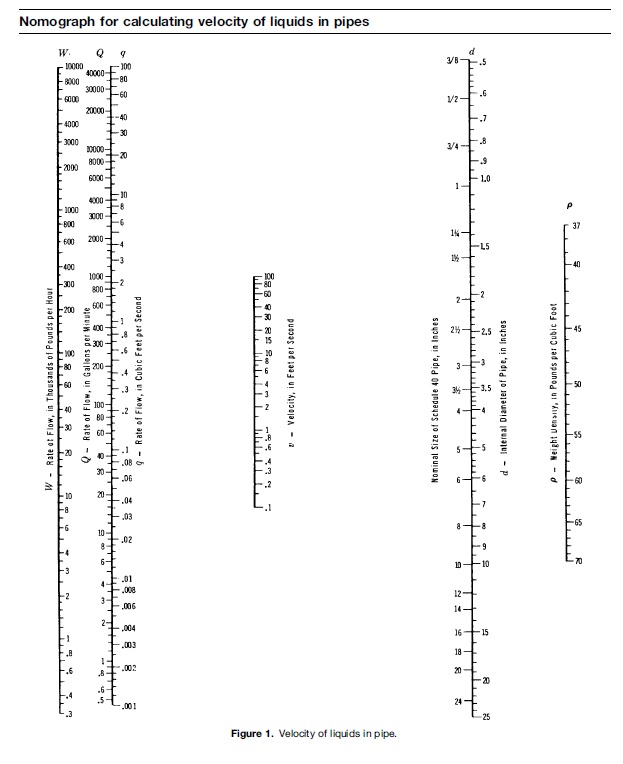
Velocity Method and Kent equation: This method involves calculating the required pipe diameter based on a desired fluid velocity. The recommended velocity range for liquid flow is shown below. This method is relatively simple, but it does not take into account the effect of pressure drop and can result in oversized or undersized pipes.
Velocity MethodKent Method
Example-1
Calculate line size to carry water flow of 60 m3/h temperature 300 degC through a distance of 200 meters.
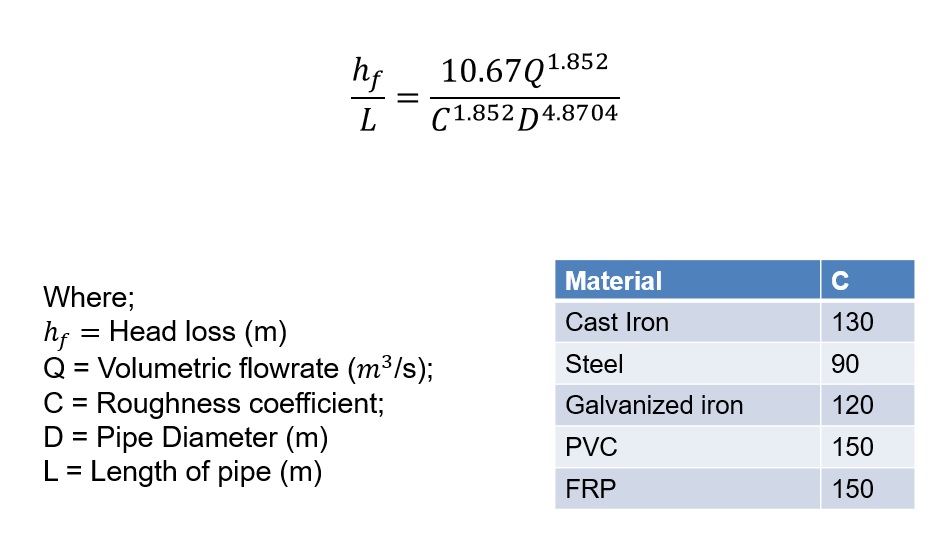
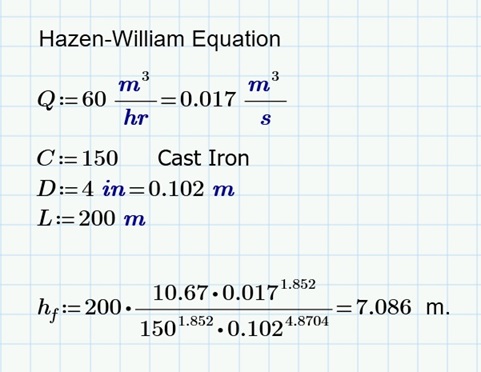
Hazen-Williams Equation: This equation is a semi-empirical formula that relates the flow rate, pipe diameter, and pressure drop for a given fluid and pipe material. It is commonly used for water flow in pipes and is based on experimental data. The Hazen-Williams equation is relatively simple to use, but it has limited applicability for fluids other than water.
Example-2
Calculate of the pressure of a pipe of 4-inch diameter carrying of water flow of 60m3/h temperature 300 degC through a distance of 200 meters. The pipe material is Cast Iron with an absolute roughness 0.25 mm. by using the Hazen – William Equation.
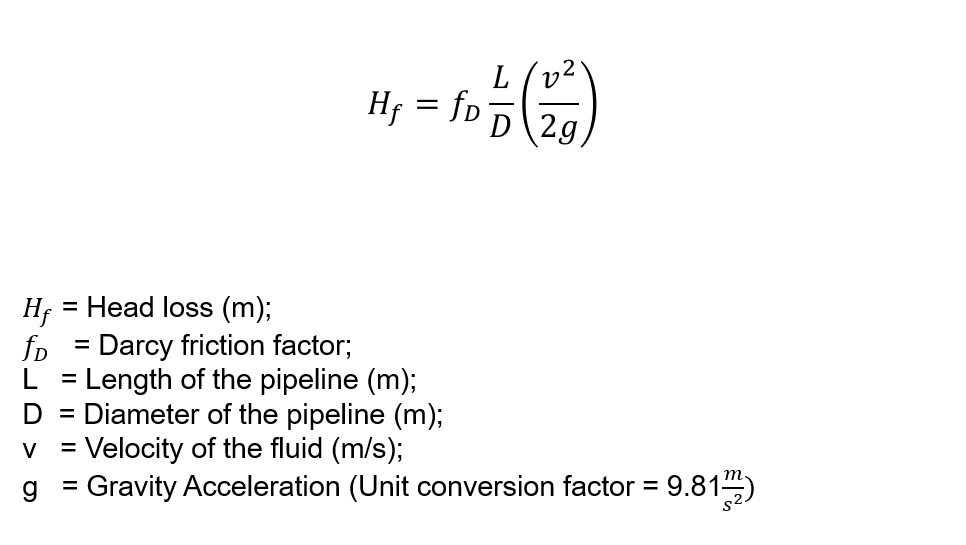
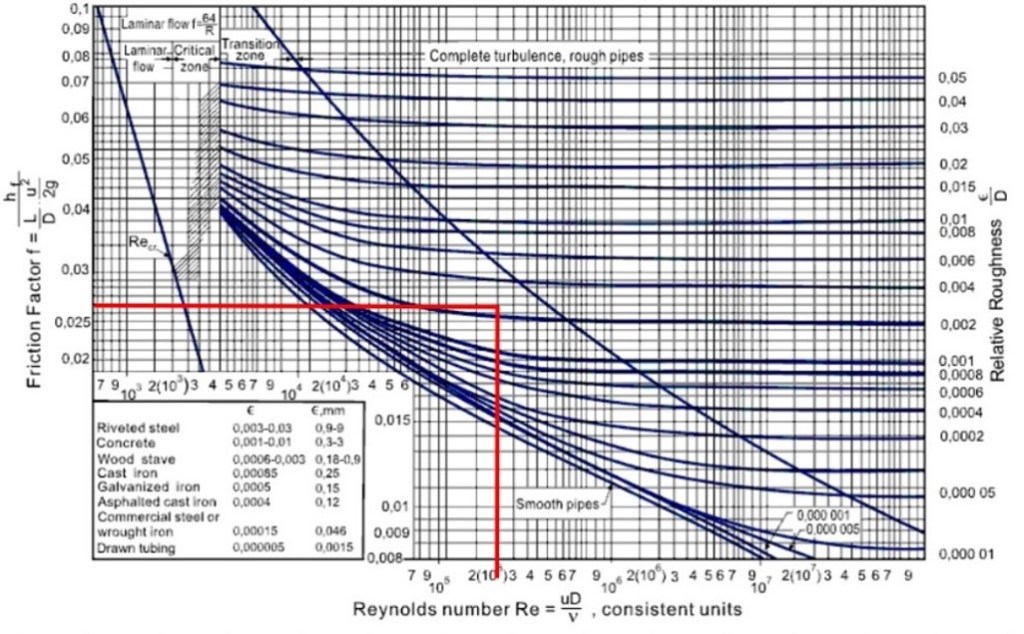
Darcy-Weisbach Equation: This equation is a more general form of the pressure drop method, and it takes into account the effect of fluid velocity, pipe diameter, roughness factor, and other factors. It is widely used in fluid mechanics and is applicable to a wide range of fluids and pipe materials. The Darcy-Weisbach equation is more complex than the Hazen-Williams equation, but it provides more accurate results. The Darcy-Weisbach equation is commonly used for designing water supply-system, oil and gas, and HVAC systems.
Example-3
Calculate of the pressure of a pipe of 4-inch diameter carrying water flow of 60m3/h temperature 300 degC through a distance of 200 meters. The pipe material is Cast Iron with an absolute roughness 0.25 mm. by using the Darcy Equation.
From the Moody chart in the above figure, it can be distinguished into the equations in laminar flow region, equations for smooth pipe turbulent flow, and an equation for completely turbulent flow.
The next formula is a more accurate method than the Moody chart is the Colebrook equation.
However, the Colebrook equation cannot be solved analytically, so it must be solved numerically using iterative methods.
The other equation is the Haaland equation. It is a modified version of the Colebrook equation which is less computationally intensive than the Colebrook equation.
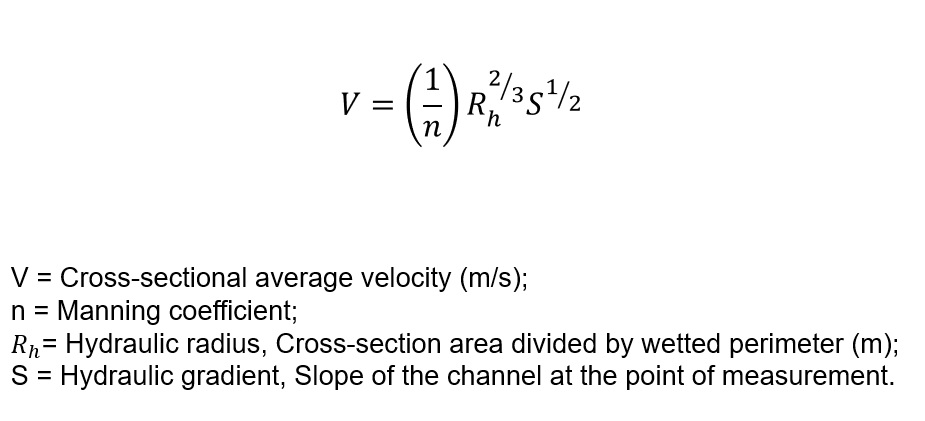
The Manning formula. This equation is commonly used in open channel flow calculations, but it can also be applied to pipe flow as well. The Manning formula takes into account the effect of slope and able to be used if the liquid is not fully enveloped.
Compare equations
Equation
Advantage
Disadvantage
Darcy and Fanning Equation
Applicable to both laminar and turbulent flow. Accounts for pressure drop. Widely used in engineering practice.
Assumes constant properties and steady-state conditions. Not accurate for flow through noncircular pipes. Requires iterative calculations.
Hazen-Williams equation
Simple to use and understand. Applicable for steady-state, turbulent flow in circular pipes. Accounts for friction and diameter changes.
Less accurate than Darcy. Limited to circular pipes with constant diameter. Assumes uniform flow and smooth pipe walls.
Manning equation
Accounts for irregular pipe shapes and nonuniform flow. Useful for open-channel flow and gravity-fed systems. Widely used in civil and environmental engineering applications.
Assumes constant roughness coefficient. Less accurate for laminar flow or flow with sudden changes in slope or channel shape.
Navigating life’s intricate fabric, choices unfold paths to the extraordinary, demanding creativity, curiosity, and courage for a truly fulfilling journey.
Service 3
$199
Navigating life’s intricate fabric, choices unfold paths to the extraordinary, demanding creativity, curiosity, and courage for a truly fulfilling journey.
Process Hazard Analysis (PHA) is the methodology to identify and assess potential hazards associated with the handling, processing, and storage of hazardous material. Techniques such as Hazard and Operability Studies (HAZOP), What-If Analysis, Failure Modes and Effects Analysis (FMEA), and Checklist may be employed during PHA.
Hazard and Operability (HAZOP) study
HAZOP method is used in many industries such as chemical, refinery, petrochemical, etc which are used to identify the potential hazard scenario from the process deviation or operability deviation such as “No Flow”, More Level”, etc impacts on the onsite people, environment, and asset. The process of reviewing will run along with the process deviation (process parameter + HAZOP guideword).
The what-if method involves posing the question “What if” relating to initiating events to identify hazard scenarios for a process. “What-if” scenarios can be used to imagine the future and its implications. This helps anticipate and prepare for potential advancements.
In essence, “What-if” encourages a form of mental exploration, an open-minded approach where individuals or groups consider various possibilities and their potential outcomes. It’s a valuable tool for strategic planning, risk management, and fostering creativity.
FMEA is a hazard evaluation method in which failure modes of system components, typically, equipment components, are considered to determine the effects and safeguards in place. Failure Mode describes how a component fails such as “Open”, “Close”, “Over”, and, etc. The FMEA can be applied in deeper study as an FMECA (Failure Mode and Effects and Critically Analysis) or FMEDA (Failure Mode and Effects and Diagnostic Analysis).
A checklist used as a hazard evaluation method employs a predefined list. A predefined list will raise the list of questions, tasks, or steps relating to identifying concerns and prompt the analyst to accomplish, verify, or consider. Checklists are used in various fields and contexts to ensure that important items are not overlooked, tasks are completed, and processes are followed systematically.
Compare PHA Techniques
HAZOP
What-If
FMEA
Checklist
Methodology
Systematic and structured technique by dividing the system into Node.
More informal brainstorming and discussing hypothetical.
A systematic way to identify potential failure mode of individual components
Use a predefined checklist for analysis
Approach
Consider process parameters such as Flow and their deviation such as No Flow.
Open discussion on various scenarios.
Identify failure mode, their effects, likelihood, severity, and detectability.
Checks off items on the list
Output
Potential Cause, consequence, and recommendation.
Identify hazards, consequences, and recommendations.
Results in a risk priority number (RPN) for each failure mode
List of identification of specific hazards
Applicability
Analysis of complex processes such as refinery.
Often used in early stages or in Manage Of Change review
Commonly used in automotive, aerospace, and manufacturing
Commonly used in all industries
The other PHA techniques are such as Preliminary Hazard Analysis (PrHA), Major Hazard Analysis (MHA), Fault Tree Analysis (FTA), Event Tree Analysis (ETA), Cause-Consequence Analysis (CCA), Consequence Analysis, and Bow-Tie Analysis (BTA)
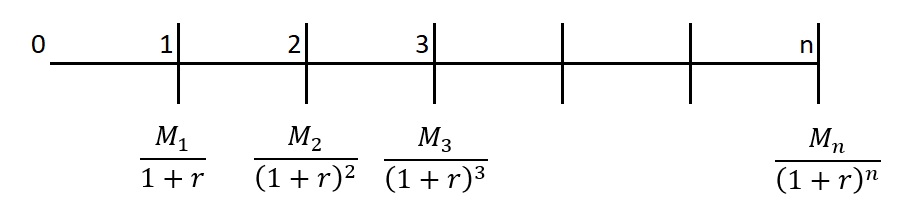
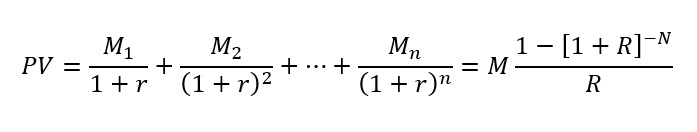
The Present Value (PV) of an annuity is a financial concept that represents how much money would be required now to produce a series of payments in the future, against assuming a constant interest rate.
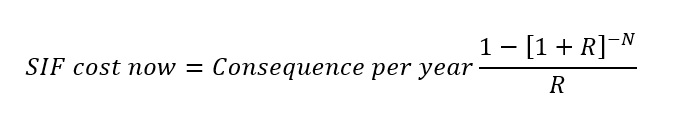
When applying the Present Value of an annuity to justify the maximum of SIF before investment. We can apply the consequence per year (Consequence x Initial Event Likelihood) to a consequence per year and the mathematical formula has been changed to the following.
Example-1
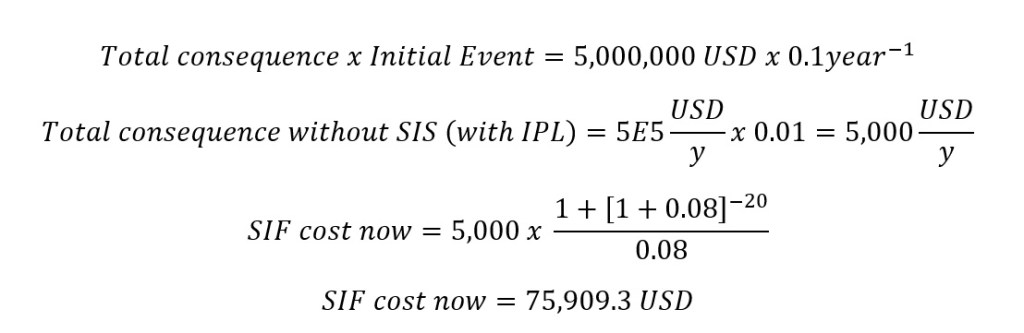
The result of the malfunction of the pressure controller is a leakage from ethylene evaporation overpressure. This will lead to a vapor cloud explosion (VCE) and that will cause asset catastrophic damages 5,000,000$. Currently, the existing plant has the PSV to prevent the overpressure. An SIS is being considered to reduce the risk which the expected life is 20 years and the interest rate is 8%. What is the highest amount of money that can be cost-effective?
Benefit-To-Cost (BTC) Ratio
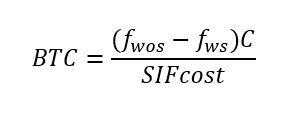
The benefit-to-cost ratio or (BTC) is a financial metric used to evaluate the profitability and feasibility of an investment. For the specific application to the SIS context, the BTC has calculated the effectiveness of the SIS compared with the total SIF cost. The formula for Benefit-To-Cost (BTC) ratio is as follows:
If BTC > 1, it indicates that the benefits of SIS outweigh the investment costs, suggesting that the investment is potentially worthwhile.
If BTC <1, it suggests that the SIF costs exceed the benefits, which may raise concerns about the economic viability.
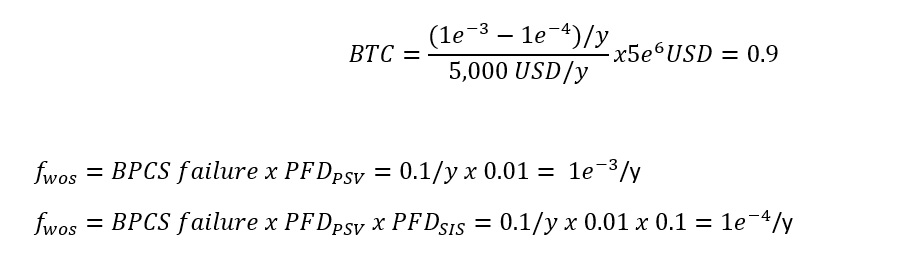
Example-2
From example-1, the client is considering installing an SIF-SIL1 which will have an annualized cost of 5,000 USD. What is the benefit-to-cost ratio for an installation of the SIF?
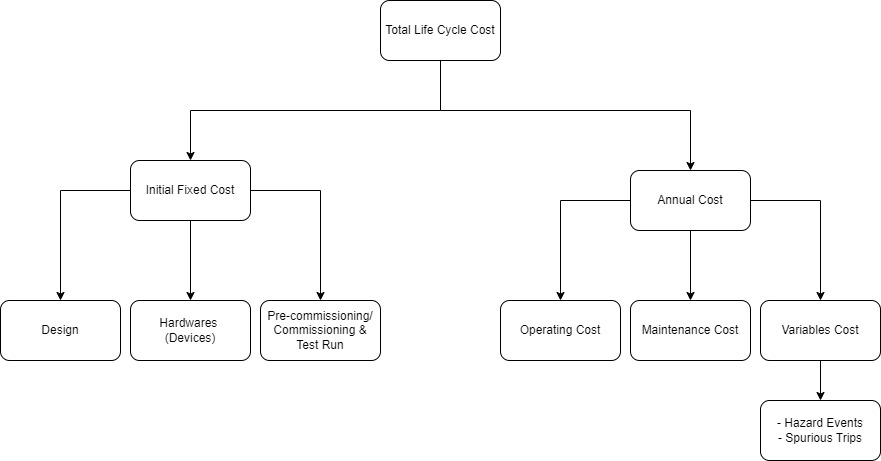
Life Cycle Cost (LCC)
The life Cycle Cost or LCC presents the total cost of an installation and operating cost or annual cost. The below figure presents typical components of the life cycle cost for a safety instrumented system.
Total Life Cycle Cost (LCC) consists of two types which are fixed cost (USD) and time/event base (USD/time).
To evaluate the Safety Integrity Level will meet the SIL requirement to reduce the risk to an acceptable level. 3 things are required to be verified.
Probability of Failure on Demand average (PFDavg);
Architecture Constraints;
Systematic Capability (SC).
Probability of Failure on Demand average (PFDavg)
The performance or effectiveness of SIL is presented by the Probability of Failure on Demand (PFD).
SIL Level
PFDavg (Low Demand)
RRF
PFHavg (High Demand)
1
<10-1 to < 10-2
>10 to 100
<10-5 to < 10-6
2
<10-2 to < 10-3
>100 to 1,000
<10-6 to <10-7
3
<10-3 to < 10-4
>1,000 to 10,000
<10-7 to <10-8
4
<10-4 to <10-5
>10,000 to 100,000
<10-8 to <10-9
SIL Level Table
Architecture Constraints IEC 61508
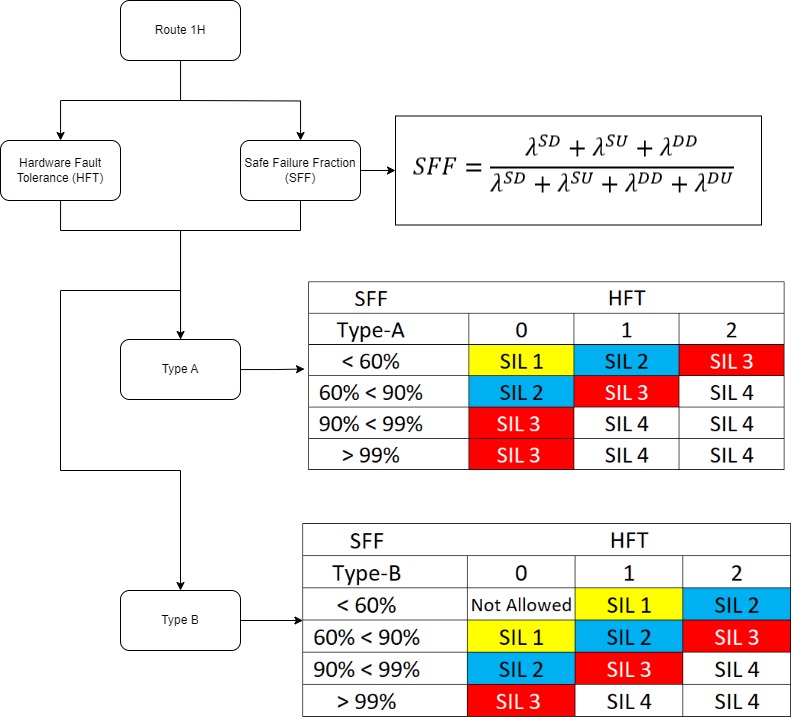
IEC 61508:10 provides two alternative approaches called Route 1H and Routh 2H.
Route 1H application to new technology devices which users did not have experience with. Hence, it will be based on Hardware Fault Tolerance (HFT) and Safe Failure Fraction (SFF) values.
The HFT indicates the number of dangerous failures the architecture can withstand before losing the ability to perform the safety function.
IEC 61508 defines two categories of devices, Type A and Type B.
Type A: A subsystem that all possible failure modes can be determined for all constitute components i.e. solenoid, whereas;
Type B: A subsystem that has behavior under fault conditions that can not be completely determined for at least one component i.e. logic solver
Route 2H is based on reliability data from field feedback on similar devices. It recognized the real need for the redundancy. Hence, the SFF metric is not used.
IEC 61508 Route 2H
SIL
Mode
Minimum HFT
1
Any
0
2
Low-Demand
0
2
High or Continuous
1
3
Any
1
4
Any
2
Architecture Constraints IEC 61511
It can be clearly seen that IEC 61511: 2016 was derived from IEC 61508: 2010 Route 2H.
SIL
Mode
Minimum HFT
1
Any
0
2
Low-Demand
0
2
High or Continuous
1
3
Any
1
4
Any
2
Systematic Capability (SC)
The term Systematic Capability (SC) in an IEC 61508 means that the design, test, and manufacturing processes used to create and build the product have a level of integrity needed for the required SIL. Hence, the Systematic Capability or SC can be found in product certification from the manufacturer.