Standards and Guidelines ในการศึกษา RBI มักปฏิบัติตามมาตรฐานอุตสาหกรรมเช่น API 580 (guidance on RBI implementation) และ API 581 (quantitative RBI methodology)
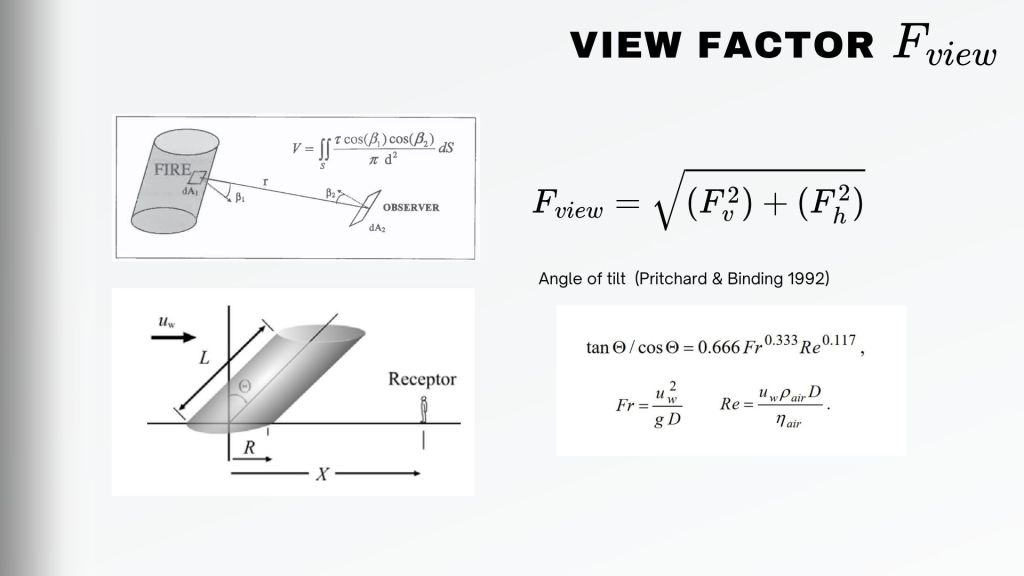
เพลิงไหม้มักเป็น Process Hazard consequence ที่มักจะเจอในระหว่างการศึกษาชี้บ่งอันตราย Hazard Identification (HAZID) หรือ Hazard and Operability (HAZOP) study โดยในบทความนี้จะขอกล่าวถึงสมการพื้นฐานที่ใช้ในการศึกษาความร้อนที่จะเกิดขึ้นในระหว่างเหตุการณ์ไฟไหม้
กำลังการปล่อยสูงสุดจากพื้นผิว หรือ SEPmax เป็นค่าที่บอกกำลังการปล่อยจากพื้นผิวของเปลวไฟโดยไม่มีเขม่า ซึ่งสามารถคำนวณได้เป็นฟังก์ชันของอัตราการเผาไหม้ (m’) ความร้อนของการเผาไหม้ Heat of Combustion อัตราแฟคเตอร์การแผ่รัง Fraction of Heat Radiation ดังนี้.
Actual Surface Emitting Power (SEPact)
แต่กำลังปล่อยพลังงานจากพื้นผิวจริง จะพิจารณาจากสภาพจริงของการลุกไหม้ที่อาจมีเขม่าอยู่ โดยมีความแตกต่างกันอยู่บ้าง ในเพลิงไหม้แบบ Pool/Jet Fire กับ Fire Ball จะสังเกตุเห็นได้ว่า ถ้าเป็นไฟไหม้แบบ Fire Ball จะสมมุติให้ไม่มีเขม่าเกิดขึ้น
The large range of activities carried out on or near the sea during marine operations will result in high-risk activities that demand very intensive approaches to monitor and control during the hazard identification, or HAZID, study or Risk Assessment (RA). Below are some examples of the kinds of vessels that are utilized in offshore operations.
Type of vessel operations in offshore include:
Supply Vessel: These vessels transport goods, equipment, and personnel to offshore platforms, rigs, and installation.
Diving Support Vessels (DSVs): Used to support diving operations for inspection, repair, and maintenance of offshore structures.
ROV Support Vessel (RSV): An ROV support vessel is a vessel with specialized equipment and space to store, deploy, and support ROVs for their subsea intervention.
Transportation Barges and Tug Boats: Subsea structures are normally transported from onshore to the offshore installation site by transportation barge. Generally, the transportation barges are towed by tug boats from one location to another.
Heavy Lift Vessels (HLV): A heavy lift vessel (HLV) is a vessel with a specific crane that has a large lifting capacity. These vessels are equipped with heavy lifting equipment such as cranes, derricks, or jib arms capable of hoisting and moving extremely large and heavy objects.
Pipe-Laying Barges (PLB): Pipe-laying vessels can be categorized according to their pipe-laying methods based on site characteristics such as water depth, and weather. The typical three types of PLB are S-Jay, J-Jay, and reel-lay type.
Umbilical-Laying Vessel: Umbilicals can be installed by a reel-lay vessel or carousel-lay vessel where the umbilical are cables, or hoses that contain multiple components such as power cables, hydraulic lines, and control lines.
General Hazards of Marine Operation
The following are the general hazards of maritime operations that are identified during hazard identification, hazard identification studies, or risk assessments (RAs).
Collisions: Barges can collide with other vessels, structures, or natural features, leading to damage to property, injury, or loss of life. Collisions may occur due to factors such as poor visibility, navigation errors, or equipment failures.
Grounding: Barges can run aground on shoals, sandbars, or other underwater obstacles, especially in shallow or poorly charted waters. Grounding can cause damage to the barge, cargo, and the environment, as well as disrupt navigation in the area.
Capsizing or Sinking: A barge can capsize or sink due to factors such as adverse weather, improper loading, or structural damage.
Cargo Spills: Transportation barges often carry bulk cargo such as oil, chemicals, or other hazardous materials. Spills of these substances can occur due to accidents, leaks, or improper handling, resulting in environmental pollution and harm to aquatic life.
Fire and Explosion: Cargo carried on transportation barges, such as fuel, chemical, or flammable materials, can pose a risk of fire or explosion, especially in the event of a collision, grounding, or equipment failure.
Navigation hazards: Barges may encounter navigation hazards such as bridges, locks, dams, and other vessels, which require careful maneuvering and coordination to avoid collisions or other incidents.
Safeguards protection of Collision hazards
The following are the general safeguards protection against collision hazards that are identified during hazard identification (HAZID) or risk assessments (RAs).
Collision hazards: Collision hazards are common hazards in Maritime Operations, Vessel owners and masters should ensure that any operations that involve approaching, working alongside, and departing from any offshore facility are at all times.
Navigation Rules and Regulations: Commonly called 72 COLREGS (Convention On the International Regulations for Preventing Collisions at Sea) which were developed by the Inter-Governmental Maritime Consultative Organization (IMCO) which was renamed to Internation Maritime Organization (IMO).
Safety Zone: The Safety Zone or Exclusion Zone is the area around offshore platforms where unauthorized vessels are prohibited from entering to prevent collision.
Dedicated approaching location: The approaching location course will take the vessel to a position where it can be set up for intended operations. This course is set at a tangent to the safety zone. The direct approach is forbidden.
Proper selection of the station-keeping method. The operation vessel shall assess the station-keeping location which shall be supported together with prevailing and forecast conditions.
Proper setting up before moving alongside: Vessels should set up in the vicinity of the face to be worked on the appropriate heading. When setting up to work in a drift-on situation the vessel should be directly up-weather and/ or up-tide of the facility.
Use of Dynamic Positioning (DP): DP is a control system used to automatically maintain the position and heading of a vessel without the need for traditional anchoring. DP system utilize a combination of propulsion thrusters, sensors, and control algorithms to continuously monitor and adjust the vessel’s position and heading relative to a set reference, typically specified by GPS coordinated or a fixed location.
Electronic Navigation Aids: All vessels shall be equipped with navigation aids (NAV. aids) to detect other vessels and obstacles.
Gyro Compass: Gyro Compass is used to find the correct north position, unlike a magnetic compass, the gyrocompass is not interfered with by an external magnetic field.
Radar: Marine vessels rely on a S-band and X-band radar system for navigation the object and display information on the screen such as distance from ground, obstacles, etc.
Global Positioning System (GPS):
Electronic Chart Display and Information System (ECDIS): ECDIS is developed from the Electronic Navigational Chart (ENC) which can integrate with radar, GPS, AIS, and Echo sounder:
Automatic Radar Plotting Aid (ARPA): ARPA displays the location of the ship and other vessels nearby. The radar displays the location of nearby ships and selects a course for the ship.
Automatic Identification System (AIS): AIS is used for vessel tracking. It broadcasts a vessel’s identity, position, course, speed, and other relevant information accurately. AIS used VHF radio channels as transmitters and receivers between vessel.
Prevailing condition monitoring
Wave height is not more than 1.5 meters
Wind speed at 10 m above sea level is within 20 knots.
Lookouts and Watchkeeping: Vessels maintain a proper lookout at all times to visually observe the surrounding.
We must first understand the components of the CALM system in order to begin the hazard identification, (HAZID) study, or risk assessment (RA) for maritime operations.
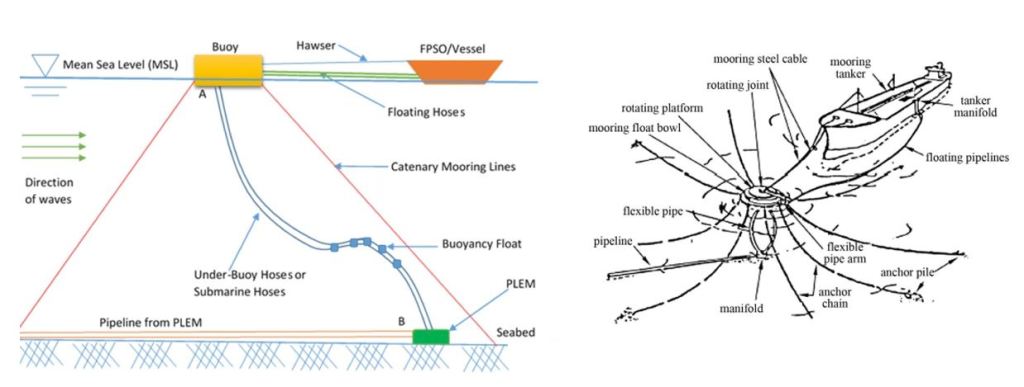
Catenary Anchor Leg Mooring (CALM) is one type of the Single Mooring System (SMS) which is a part of the Floating Production Storage and Offloading (FPSO) system.
CALM is a type of mooring system commonly employed for the transfer of crude oil, and liquefied natural gas (LNG) between tanker ships and offshore platforms or buoys.
The CALM system typically consists of a floating buoy connected to the seabed by several anchor chains or cables, creating a catenary shape. Tanker ships can then moor to the buoy via a mooring line.
The CALM setup allows for the safe and efficient transfer between the tanker and the offshore facility. The CALM system can accommodate a wide range of tanker sizes and types, including single-point moorings (SPMs) and FPSO, even in rough sea conditions, including strong wind, waves, and currents as the buoy’s flexible connection to the seabed helps to adsorb the forces exerted by waves and currents.
The main components of the system are as follows;
Buoy: The primary function of the buoy is to provide buoyant force, keeping the entire CALM afloat. The buoy serves as the connection point for mooring lines or chains that anchor it to the seabed. Buoys often include navigational aids such as lights, reflectors, or radar reflectors to enhance visibility and help marine vessels locate the CALM system, especially during low visibility or at night.
Rotating platform: The rotating platform installed on the upper portion of the float bearing when the wind direction changes it can rotate around the center of the floor 360 degrees through the mooring force ;
Rotary joint: The rotary joint is typically located at the transfer between the buoy and the mooring hawser or fluid transfer hose. It serves as the connection point. The rotary joint allows the rotation movement to occur without disrupting the fluid transfer process since the waves and currents can cause the rotational motion at the connection point. The rotary joint incorporates a sealing mechanism to prevent fluid leakage between the stationary and rotating components.
Anchor chain. Anchor chains are typically attached to the buoy at one end and connected to the anchor piles or anchors on the seabed at the other end. This connection creates a secure link between the buoy and the seabed. The anchor chains are arranged in a catenary configuration, commonly six chains composed of many links.
Anchor pile: Anchor piles serve as anchor points for the mooring lines or chains that extend from the floating buoy to the seabed. These mooring lines are typically arranged in a catenary configuration, providing a flexible connection that allows the buoy to move with the waves and currents while maintaining its position relative to the seabed.
Hose: CALM hoses are designed to handle high-pressure offshore oil and gas material transferring. They are engineered to withstand the hydraulic forces generated during fluid transfer and maintain their structural integrity, even though they are bent and flexed with the movement of the waves and currents. CALM hoses are typically made of durable and corrosion-resistant material. These materials are chosen for their ability to withstand exposure to seawater, UV radiation, and harsh environmental conditions.
Buoyancy tank: The buoyancy tank provides the necessary buoyant force to keep the CALM buoy afloat by displacing water equal to its weight, the buoyancy tank ensures that the buoy remains stable and upright, even in rough sea conditions.
General environmental hazards to CALM
The following are the general environmental hazards of CALM operations that are identified during hazard identification (HAZID) or risk assessments (RAs).
Storms and Extreme Weather: Severe weather conditions such as hurricanes, typhoons, and strong storms can subject CALM systems to high wind, large waves, and intense currents. These environmental forces can exert significant loads on the mooring lines, buoys, and anchoring system, potentially leading to damage or failure.
Corrosion: The marine environment exposes CALM components, such as chains, cables, and buoys, to corrosion. Corrosive agents in seawater, such as salt, can degrade and structural integrity of these materials over time, increasing the risk of failure if not properly monitored and maintained.
Wave and Current Loading: CALM systems are designed to accommodate wave-induced motions and dynamic loads. However, extreme wave conditions or strong currents can exceed design parameters, leading to excessive stress on the mooring lines, buoys, and anchoring system.
Vessel Collisions: CALM buoys and associated infrastructure are vulnerable to collisions with vessels, including tankers, supply vessels, or other marine traffic. A collision can cause structural damage to buoys or its mooring system.
Subsea Hazards: Subsea hazards such as underwater obstructions, pipelines, and geological features can pose risks to CALM systems during installation, operation, and maintenance activities.
Siltation and Seabed Instability: Changes in seabed conditions, such as siltation, sedimentation, or subsidence, can affect the stability of the CALM anchoring system. Seabed instability may lead to anchor drag, loss of holding capacity, or misalignment of mooring lines, potentially compromising the safety and reliability of the mooring system.
Dropped objects can damage subsea pipelines, leading to leaks, structural integrity issues, and the potential for environmental damage. Hence, drop object risk is normally assessed during Hazard Identification (HAZID) study.
Subsea pipelines are susceptible to impacts due to dropped objects from vessels, anchors, interference with other pipes, and trawl boards.
Hence, a Dropped Object Study (DOS) is required for any installation or vessel operating in the vicinity of flexible pipes, and ROVs (Remotely Operated Vehicles) should be deployed to determine the location of the dropped object on the seabed and examine the surrounding pipes for any potential damage.
Deck lifting and handling procedures should be in place and intended to prevent dropped object incidents.
Fishing vessels have been documented to also cause damage to the pipe due to impact between trawl boards and pipes, not from the dropped object. Hence, having a vessel exclusion zone extending beyond the touch-down regions of all the risers is usually enforced.
Drop Object Study (DOS)
The Drop Object Study (DOS) refers to a numerical study that assesses the behavior and impact of objects being dropped from a height onto offshore structures, such as oil rigs, pipelines, or platforms. Hence, Drop Object Study is a kind of Quantitative Risk Assessment (QRA).
These studies are conducted to understand how these structures would respond to accidental dropping of heavy objects, evaluate the potential risks, and design measures to minimize any potential hazards. This study provides benefits to an engineer who is responsible for assessing structural integrity.
Hence, the aim of this study is to ensure that the structures can safely absorb or distribute the impact energy, protecting both the structure itself and the personnel working on the offshore facility.
Drop Object Study Workflow
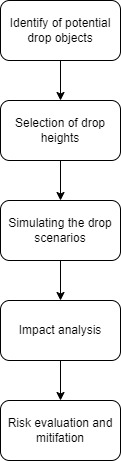
The methodology for a drop object study typically involves several steps.
Identification of potential drop objects: The first step is to identify the objects that are likely to be dropped on the offshore structures during Hazard Identification (HAZID) study, such as handtools, equipment, or material. This could include items that may accidentally fall from heights, or even potential projectiles in case of extreme weather conditions.
Selection of drop heights: Different Drop heights are considered to evaluate the potential impact of energy on the structure. These heights are chosen based on the maximum foreseeable height from which objects may fall.
Develop the impact analysis.
Impact Energy
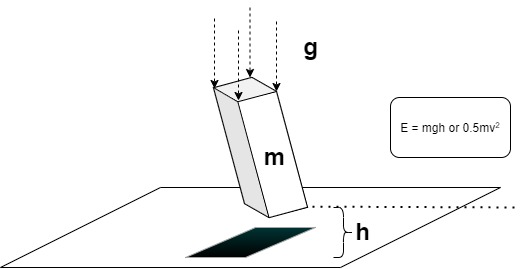
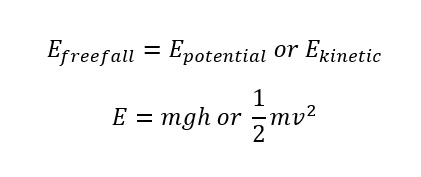
During Impact Analysis, we have to calculate the Impact Energy which refers to the amount of energy generated during the impact of an object. In the context of a drop of object study, impact energy is the energy transferred to the structure when an object is dropped from a height and collides with it.
The impact energy is calculated by considering the mass of the object and its elevation or velocity at the time of impact.
E is the potential energy of a dropped object (J);
m is the mass of the dropped object (kg);
g is the gravitational acceleration (9.81 m/s2); and
h is the drop height above the impact surface (m)
Hit Probability
Since, the Drop Object Study (DOS) is considered like the Quantitative Risk Assessment of QRA, the probability of hitting to vulnerable equipment or personal underneath shall also be assessed.
p(x) = Probability of sinking object hitting the sea bottom at a distance x from the vertical line through the drop point
x = Horizontal distance at the sea bottom (m)
Delta = Lateral deviation (m)
Drop Object Protection
Drop Object protection measures are implemented to prevent objects from accidentally falling onto subsea pipelines, structures, or equipment during offshore operations. Some common drop object protection measures such as.
Pipeline Routing: Selecting pipeline routes away from the area with high vessel traffic, fishing activities, or other potential sources of dropped objects.
Safety Nets: Safety nets are installed below work areas, platforms, or scaffolding to catch objects that may accidentally fall. Safety nets are particularly useful in areas where the risk of dropped objects is high, such as during construction or maintenance activities.
Guardrails: Guardrails are used to create physical barriers around the perimeter of work areas, platforms, or equipment to prevent objects shifted from the dedicated area.
Engineering Controls prevent rigging failure: Rigging system, including lifting and hoisting equipment such as cranes, winches, davits, lifting gear, shackles, slings, hooks, etc. The following are engineering control measures to prevent rigging failure.
Designing rigging systems for strength and stability;
Using redundancy and safety factor
Implementing load monitoring systems such as load cells or tension monitoring devices;
Installing Safety Devices such as limit switches, overload protection, and emergency stop mechanism;
Regular inspection and maintenance;
Training and certification.
Clearance Zones: Establishing clear exclusion or clearance zones around subsea pipelines helps prevent vessels, and equipment from approaching too close.
Vessel Traffic Management: Implementing vessel traffic management systems, including navigational aids, restricted areas, and communication protocols, helps prevent vessels from entering prohibited zones near subsea pipelines.
Anchor Drag Analysis: Conducting anchor drag analysis to assess the risk of vessels dragging anchors over subsea pipelines helps identify areas where additional protection measures may be needed, such as anchor handling procedures or installation of protective matting or anchors.
Subsea Pipeline Burial: Burial of subsea pipelines beneath the seabed provides physical protection against dropped objects and reduces the risk of damage from fishing activities, and anchor strikes.
Coating and Corrosion Protection: Applying protective coating and implementing a cathodic protection system on subsea pipelines helps prevent corrosion and mitigate the risk of damage from dropped objects.
Inspections and Monitoring: Regular inspections and audits of working areas, equipment, and procedures shall be conducted to identify potential hazards.
Inspection and Monitoring Techniques
Subsea inspection has the aim of determining any damage or anomalies to flexible pipes such as bucking, kinking, and holes or tears in the external sheath. This provision can be considered as the prevention method since the system’s integrity has existed and it can reduce the likelihood of damage.
Each inspection technique has its advantages and limitations, and the choice of technique depends on factors such as the depth of the pipeline, accessibility, the type of detects being targeted, and budget constraints.
Anyway, there is no single inspection or monitoring technique that can provide a complete picture of the integrity of any flexible pipeline system.
A typical inspection and monitoring system include
General Visual Inspection (GVI)/ Close Visual Inspection (CVI);
Polymer monitoring: Online, Offline, topside, and subsea;
Annulus monitoring;
Riser dynamic: Tension, angle and curvature;
Steel armor: Magnetic or radiograph
Use the process sensors, pressure, and temperature sensors.
Bore Fluid parameters monitoring
The parameters required for monitoring are temperature, pressure, volume flow rate, and the bore fluid composition;
Visual Inspection by ROV
The most important and commonly used measures.
Limit of access. ROV can maneuver around the pipeline with the provision of cameras, and lights but it cannot perform close-up inspection.
Limit to observation of the small holes in the external sheath.
Coupon Sampling and analysis
The coupons are placed in a holder in line with the transported bore fluid to observe the rate of degradation.
Commonly used for high-temperature application
Ultrasonic technique or Ultrasonic Testing (UT)
UT can detect annulus flooding but it cannot detect wire defects.
UT can be performed from the surface or using specialized tools deployed by ROVs or divers.
Radiography
Limited to topside.
Radiography is used to monitor the condition of a PVDF internal sheath at the end termination.
Vacuum Testing of Riser Annulus
A most reliable method to determine the presence of water in the riser annulus.
Sonar monitoring (riser and anchor chain monitoring system)
Limited use to date, but it can detect bend stiffener loss
Proof pressure test
Short-term assurance only
Effluent factor in the inspection
The dropped object is considered an external impact as the anchor impacts, anchor dragging, trawling, boat impact, fish-bombing, etc. The external impact is an event-based damage reason, and if the annual probability of an impact is constant, the Probability of Failure (PoF) is also close to constant. An inspection will have no or limited change on the PoF, but it is still preferable to inspect the line at regular intervals.
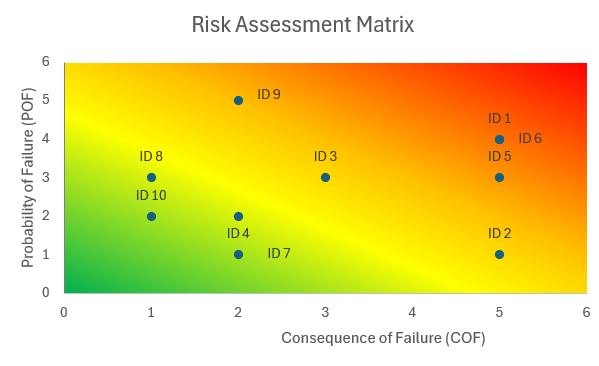
The example PoF category for the dropped object on a pipeline is based on the following information:
The outcome of the last inspection;
Frequency of material lifting (high frequency, higher PoF)
Pipeline diameter and concrete coating thickness (smaller diameter, higher PoF);
One of the toxic-liquid in Oil and Gas Exploration and Production is the Mercury. You may hear about this during performing the Hazard Identification (HAZID) study. Some potential sources of mercury substance are specified in ISO 17776 such as Electrical switches, gas filter, and etc.
However, some hydrocarbon reservoirs, especially those containing sour gas or heavy crude oil, may naturally contain elevated concentrations of mercury. Mercury can accumulate in reservoir fluids through geological processes, such as volcanic activity or the presence of mercury-bearing minerals. As a results, offshore oil and gas production facilities located in regions with mercury-containing reservoirs may encounter mercury contamination in produced fluids.
Overview Hazards of mercury risk
The following are the overview of the hazards of mercury that normally is analyzed during Hazard Identification (HAZID) study.
Corrosion and Erosion: Mercury present in produced fluids can pose a risk of corrosion to equipment since mercury has a high affinity for metals. This will lead to increase maintenance requirement and reduced equipment lifespan.
Environmental impacts: Mercury discharged from offshore production platform can pose the environmental risk to marine ecosystems and human health. This is because of mercury can contamination in produced water, drilling muds, and wastewater which can bioaccumulate in aquatic organisms, such as fish, and shellfish.
Offshore platforms may also release mercury vapor into the atmosphere during routine operation, contributing to air pollution and decomposition in coastal areas.
Health and Safety Risks: Occupational exposure to mercury vapor poses health risks to offshore worker involved in drilling, production, and maintenance activities. Mercury vapor can be releases during well testing, sampling, and handling of contaminated equipment.
Chronic exposure to mercury vapor can cause neurological and respiratory disorder.
How to treat the mercury
For sure, during the Hazard Identification (HAZID) review meeting, the provision of reduce or remove measures need to be discussed. The following information is the general technology that use to reduce or remove the mercury hazards.
Treating mercury contamination involves various techniques and technologies aimed at removing or reducing mercury concentrations in different media, such as air, water, soil, and hydrocarbon fluids.
Mercury Removal Technologies:
Adsorption: Adsorption involves the attachment of mercury ions or molecules to the surface of a solid adsorbent meterial. Activated carbon, zeolites, and other specialized absorbents can effectively remove mercury from gas streams, aqueous solution, and hydrocarbon fluids. Adsorption is widely used in air and water treatments to capture mercury contaminants.
Chemical Precipitation: Chemical precipitation involves adding chemical agents, such as sulfur-based compound (e.g. sodium sulfide), to wastewater or aqueous solutions containing mercury to convert soluble mercury species into insoluble mercury sulfide (HgS) precipitates. Precipitated mercury can then be separated and removed through filtration or sedimentation processes.
Ion Exchange: Ion exchange involves the exchange of mercury ions in solution with other ions on the surface of a solid ion exchange resin. Ion exchange resins with specific functional groups, such as thiol (-SH) or sulfide (-S) groups, can effectively capture mercury ions from aqueous solutions, facilitating their removal from contaminated water sources.
Membrane Filtration: Membrane filtration technologies, such as reverse osmosis and ultrafiltration, can remover mercury ions and particulate mercury contaminants from water by physically separating them from the solution. Membrane filtraton systems are used in wasterwater treatment plants and industrial processes to treat mercury-contaminated.
Mercury Vapor Control:
Activated Carbon Adsorption: Activated carbon filters can effectively adsorb mercury vapor from air streams by trapping mercury molecules on their porous surfaces.
Gas Scrubbing: Gas scrubbing or absorption involves passing mercury-containing air streams through a liquid scrubbing solution, such as aqueous sulfuric acid or potassium permanganate, to chemically react with and capture mercury vapor.
Mercury Recovery and Recycling:
Thermal Desorption: Thermal desorption involves heating mercury-contaminated material, such as soil, slude, or industrial waste, to high temperature to volatilize and recover mercury vapor. The recovered mercury vapor can then be condensed, captured, and recycle for reused or proper disposal.
Electrochemical Treatment: Electrochemical treatment methods, such as electrolysis and electrocoagulation, can be used to extract mercury ions from aqueous solutions by applying an electric current to induce chemical reactions that convert dissolved mercury species into solid or gaseous from separation and recovery.
Physical Properties of Mercury
Physical State: Liquid
Color: Silver
Odor: Odorless
Vapor Pressure: 0.002 mmHg @25deg.C
Vapor Density: 7
Viscosity: 15.5 mP @25deg.C
Specific Gravity: 13.59 (water = 1)
Boiling point: 356.72 deg.C
Freezing/Melting Point: -38.87 deg.C
Flash Point: Not applicable
Auto Ignition temperature (AIT): Not applicable
Explosion Limit (Lower/Upper): Not applicable
Toxicity
NFPA Rating: Health = 3, Flammability = 0, and Instability = 0.
Major Accident Event (MAE) is an accident with significant consequences or catastrophic incident in terms of human safety, environmental impact, and property damage.
The example MAE from subsea pipeline such as;
Pipeline leak, spill, or rupture;
Subsea infrastructure damage;
Subsea blowout or overpressure; and
Anchor dragging or vessel impact
Any damage and leakage of subsea pipeline can lead to the release of large quantities of oil, gas, or other hazardous substance into the marine environment. This can result in environmental pollution, damage to marine ecosystems, and impacts on the marine life and coastal communities.
Example the cause and safeguards protection
Subsea pipeline crashing during laydown operation
Site survey and route selection to check the potential of steep slopes, geological faults, or unstable sediment.
Maintain the minimum distance of existing pipeline (if any)
Design the suitable pipe wall thickness by considering the hydrostatic pressure, currents, seabed movement, potential impacts from marine crash, potential impacts from the drop objects.
If necessary, install the concrete mattress, or rock berm to prevent the pipeline movement.
If necessary to crossover the existing pipeline, provide the suitable sleeper.
Periodic General Structure Inspection (GSI) and Geotechnical Test & Inspection (GTI)
Stop production of the nearby pipeline during installation.
Utilize the ROV as supportive monitoring system during installation.
Pipeline Aging
Consider the cathodic protection;
Extent the pipeline life cycle by considering the interior lining and exterior coating;
Periodic Inline Inspection (ILT) by smart pigging
Pipeline Support Aging
Install the strain gauge, tiltmeter, or displacement sensor;
Preventive Maintenance Program;
Geotechnical monitoring such as soil moisture monitoring; slop stability analysis, or ground movement monitoring.
Rigging failure during transferring the pipe from barge to pipe laydown vessel
Training & Qualification of operation person;
Load calculation or engineering calculation;
Load inspection;
Equipment inspection such as hook, rigging gear, shackle, sling, anchor system;
Securing the load by tag line to control movement; and
Environmental considerations.
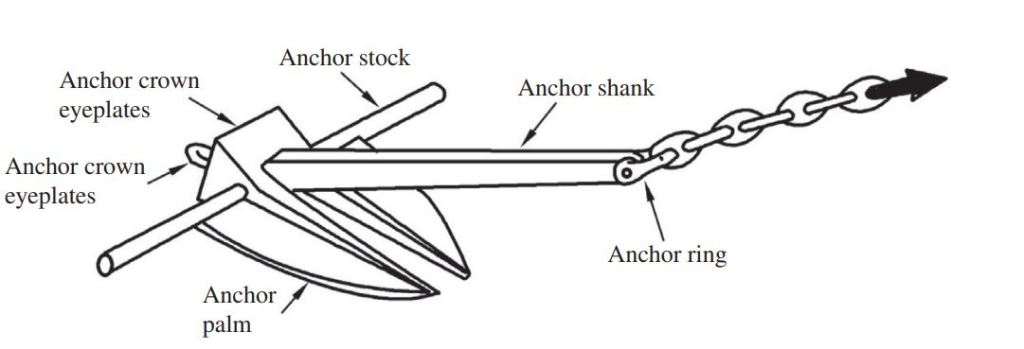
Anchor pilling of vessel damages.
Design and select the proper anchor (material, dimension, and configuration);
Installation of coating system or cathodic protection system;
Periodic geotechnical investigation i.e. soil composition, bearing capacity, potential of scour or erosion.
Selection the vessel that equipped with Dynamic Positioning (DP) system; and
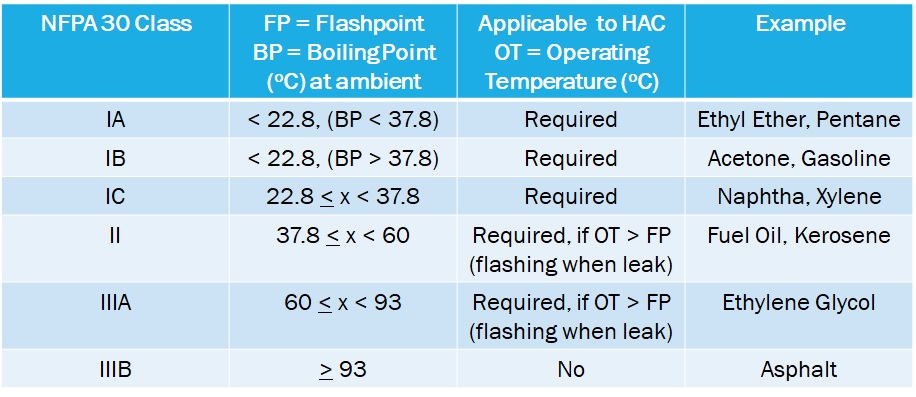
เพื่อโยงความเข้าใจเกี่ยวกับความต้องการด้าน Hazardous Area Classification (HAC) กับคุณสมบัติของสารที่สำคัญที่สุด คือ จุดวาบไฟ Flash Point จะสามารถศึกษาตัวอย่างความต้องการในการศึกษา HAC ได้ดังนี้
NFPA 30 Classification
จะเห็นได้ว่าถ้าดูจาก Flashpoint แล้วแบ่งสารตาม NFPA 30 Class สารในกลุ่ม Combustible material (IIIB) ไม่จำเป็นต้องศึกษา Hazard Area Classification อย่างไรก็ตาม ระวังความสับสนในการแบ่งกลุ่มสารตาม NFPA 30 กับ Gas และ Dust Group ที่แบ่งใน Apparatus Group ข้างล่าง
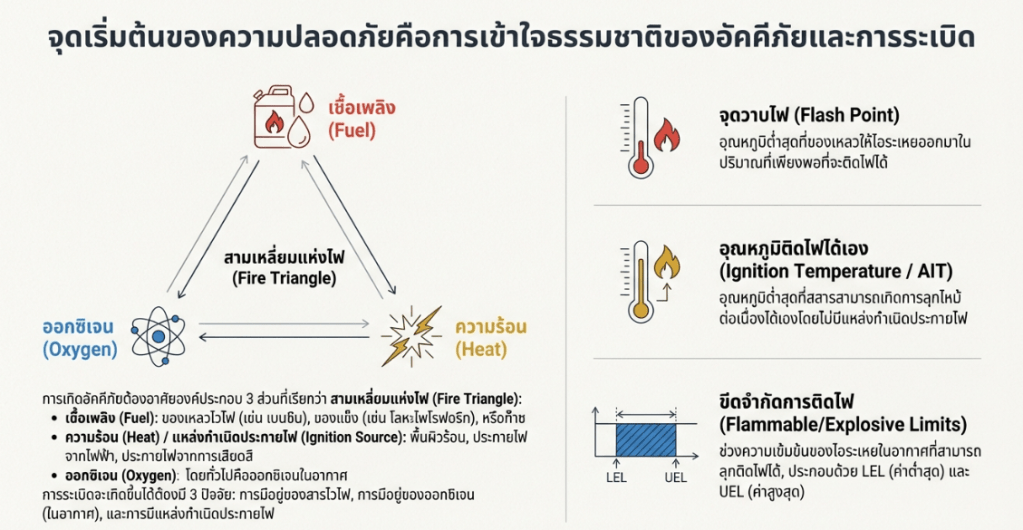
Auto ignition (หรือมักเรียกในเอกสารทางเทคนิคว่า Auto-ignition temperature (AIT) คือ อุณหภูมิต่ำสุดที่สารไวไฟ (ไม่ว่าจะเป็นของแข็ง ของเหลว หรือก๊าซ) สามารถลุกไหม้และเกิดการเผาไหม้อย่างต่อเนื่องได้เอง โดย ไม่ต้องอาศัยแหล่งกำเนิดประกายไฟภายนอก เช่น เปลวไฟ หรือประกายไฟจากไฟฟ้า
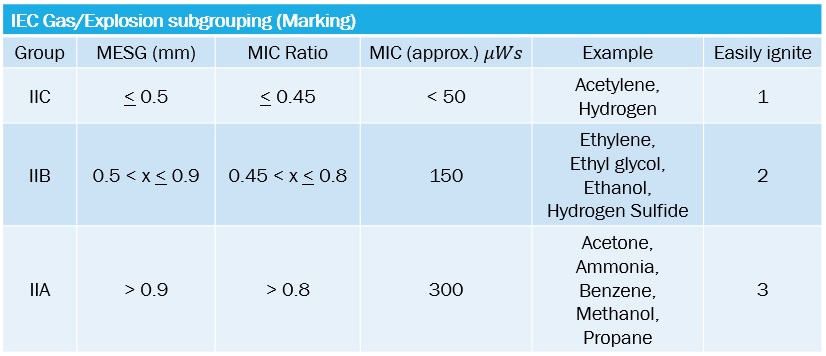
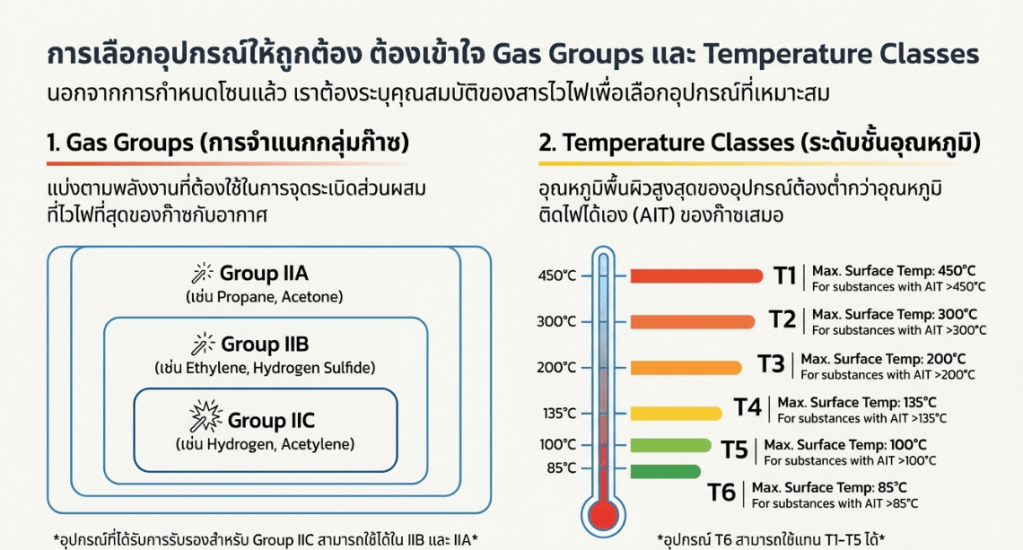
อันที่จริงการแบ่ง Gas group เพื่อเข้ากลุ่มอุปกรณ์ไฟฟ้าที่ใช้ในพื้นที่อันตราย (Apparatus Group) นั้นจัดโดยนำพารามิเตอร์เข้ามาเพิ่มอีกสองตัว คือ MIC กับ MESG
ตาราง Gas Group
ตาราง Dust Group
MIC (Minimum Ignition Current): คือ อัตราส่วนของ กระแสไฟต่ำสุด ที่ทำให้เกิดการจุดระเบิดได้ โดยเทียบกับก๊าซมีเทน (Methane) เป็นฐานอ้างอิง การทดสอบนี้มักใช้ในการประเมินความไวต่อการจุดระเบิดของก๊าซเมื่อเกิดประกายไฟไฟฟ้า (Spark) ในวงจรไฟฟ้า โดยค่า MIC มีความสำคัญอย่างยิ่งสำหรับการออกแบบอุปกรณ์ประเภท Intrinsically Safe (Ex i) ซึ่งเป็นการป้องกันโดยจำกัดพลังงานไฟฟ้าไม่ให้มากพอที่จะทำให้เกิดประกายไฟได้
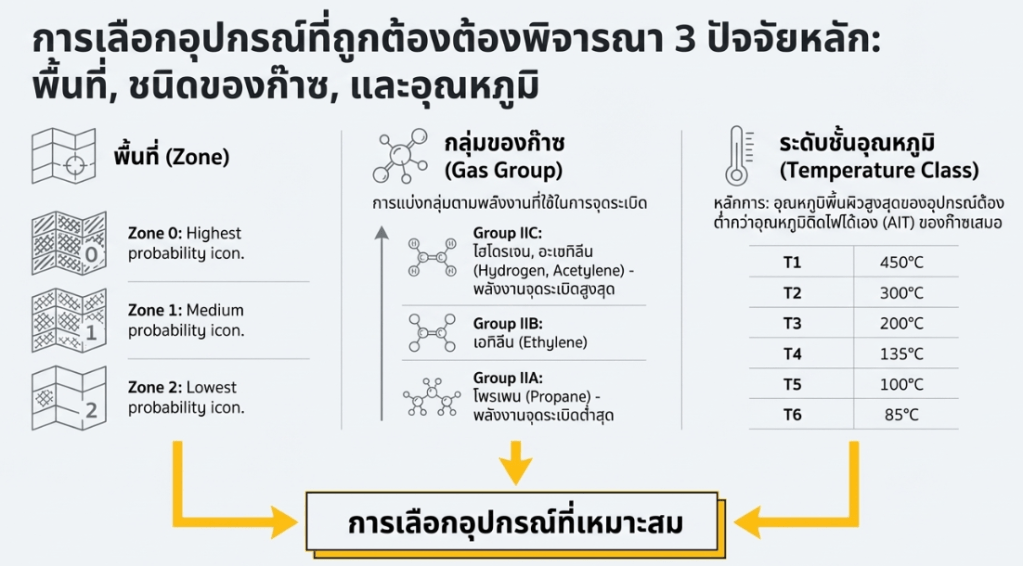
ตารางข้างล่างเป็นตาราง Temperature class ที่บอกอุณหภูมิพื้นผิวสูงสุดของอุปกรณ์ และยกตัวอย่างสารเคมีที่มีค่า Auto-Ignition Temperature ในช่วงต่างๆ
Temperature Class
Maximum allowable surface temperature (oC)
Example (AIT)
T1
> 450
Acetone (465), Ammonia (651)
T2
300 < x < 450
Ethyl alcohol (363)
T3
200 < x < 300
Diesel (210)
T4
135 < x < 200
T5
100 < x < 135
T6
85 < x <100
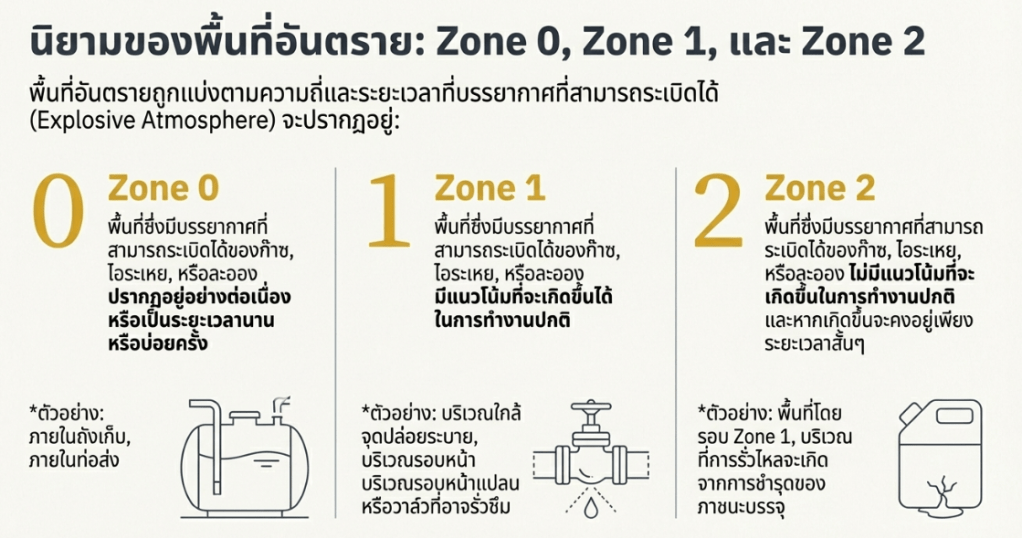
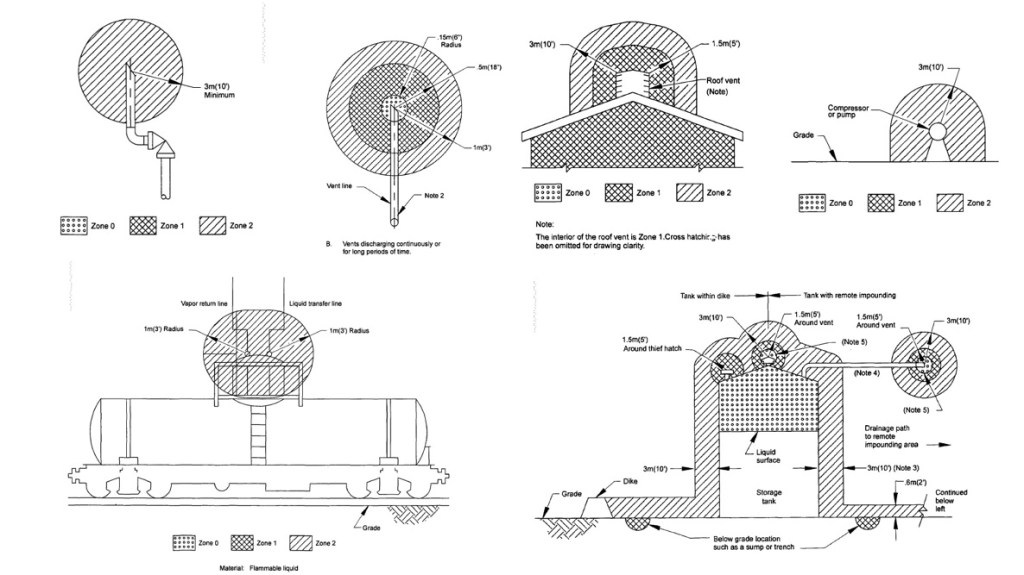
Extent of Zone
Extent of Zone คือ จุดที่ทฤษฎีทั้งหมดจะกลายมาเป็นขอบเขตทางกายภาพ ซึ่งเรากำลังจะขีดเส้นบนแบบแปลนของโรงงานเพื่อกำหนดว่าพื้นที่ใดที่ต้องติดตั้งอุปกรณ์ป้องกันการระเบิดที่ผ่านการรับรองมาตรฐาน ดังนั้น การกำหนด “ขอบเขตของโซน” (Extent of Zone) คือการคำนวณระยะห่างทางกายภาพจากแหล่งรั่วไหลที่อาจเกิดบรรยากาศที่พร้อมจะระเบิดได้
Gas leakage involves the release of gas from a containment system, whether it’s a pipe, or vessel. From a thermodynamic perspective, the process of gas leak can be understood through principles such as ideal gas law, thermodynamic equilibrium, and entropy (s).
Gas Thermodynamic Process
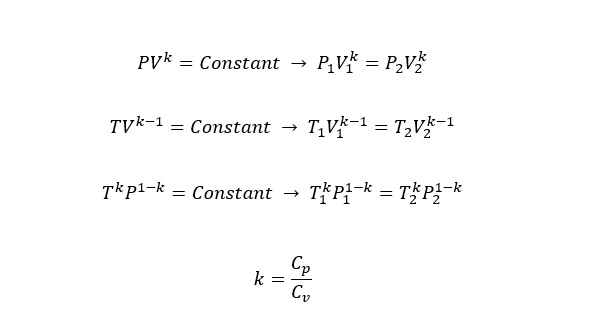
Isentropic (Adiabatic) Process
An isentropic process is one in which the entropy (s) of a system remains constant. In fact, gas leakage trends to increase entropy as the gas expands into a larger volume, resulting in a more disordered state since the entropy (s) is a measure or the disorder or randomness of a system.
In practical terms, an isentropic process is often an idealization of a process that occurs without any heat exchange with the surrounding environment. (Q = 0)
For an ideal gas undergoing an isentropic process, the relationship between pressure (P) and Volume (V) can be described as following;
For example, the isentropic process is the expansion of gas in a piston-cylinder.
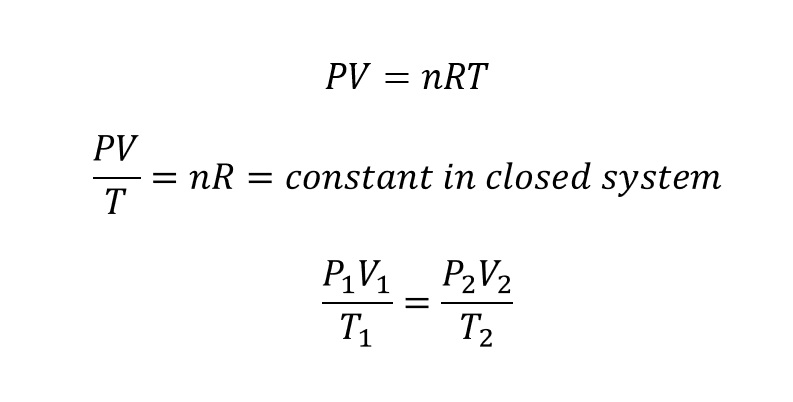
Isothermal Process
An isothermal process is one that occurs at constant temperature.
In an isothermal process, the internal energy of the system remains constant (dU = 0), meaning that any heat added to or removed from the system is entirely converted into work (Q = -W)
For an ideal gas undergoing an isothermal process, the relationship between pressure (P) and volume (V) is described by the ideal gas law.
The example process of isothermal is a gas confined within a cylinder fitted with a movable piston. And to maintain the temperature, this cylinder shall be placed in a large water bath with provided temperature by heat sink.
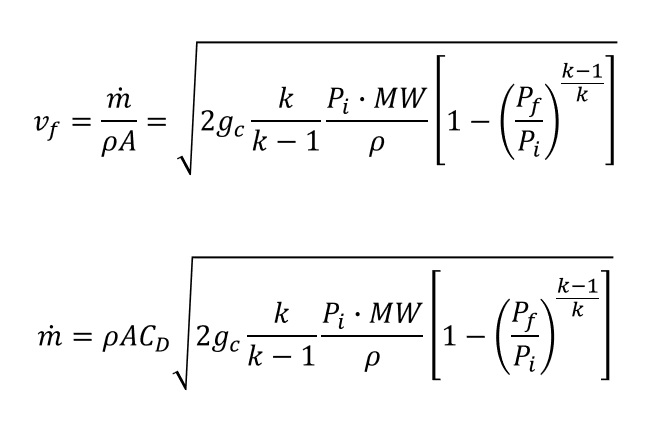
And the gas leakage formula is presented in below.
When apply the discharge coefficient (CD)
Sharp-edged orifice and Reynold number > 30,000: CD = 0.61
Short section of pipe attached to a vessel and L/D ratio > 3: CD = 0.81