Compare SIL Determination Techniques

บทความนี้จะพูดถึงวิธีการหาระดับของความปลอดภัย หรือ Safety Integrated Level (SIL) ที่ต้องการ ที่เรียกว่า SIL Determination Study หรือ SIL Classification Study จาก international standard เช่น IEC 61508-5 – Functional Safety of Electrical/Electronic/Programmable Electronic Safety-Related System Part5: Examples of Methods for the determination of safety integrity levels และ IEC 61511-3 – Functional Safety – Safety instrumented Systems for the process industry sector – Part 3: Guidance for determination of the required safety integrity levels

Risk Graph Method

วิธีแรกนี้ชื่อว่า วิธีใช้กราฟความเสี่ยง หรือ Risk Graph หรือ Risk Matrix โดยอาศัยหลักการประเมินความเสี่ยงผ่านแผนภูมิต่างๆ ทั้งที่เป็น แผนภูมิความเสี่ยงที่เกี่ยวกับตัวบุคคล Personal Safety เกี่ยวกับสิ่งแวดล้อม Environmental เกี่ยวกับเครื่องจักร Asset

โดยการใช้แผนภูมิจะมีการนำตัวแปรต่างๆมาใช้งาน เช่น ความรุนแรง (C = Consequence) ความเป็นไปได้ที่จะสัมผัสความอันตราย (F = Frequency of exposure) ความเป็นไปได้ในการหลบหนี (P = Potential of avoidance) และความถี่ในการเกิดเหตุการณ์ (W = Hazard demand rate)

Risk Graph of Personal Safety

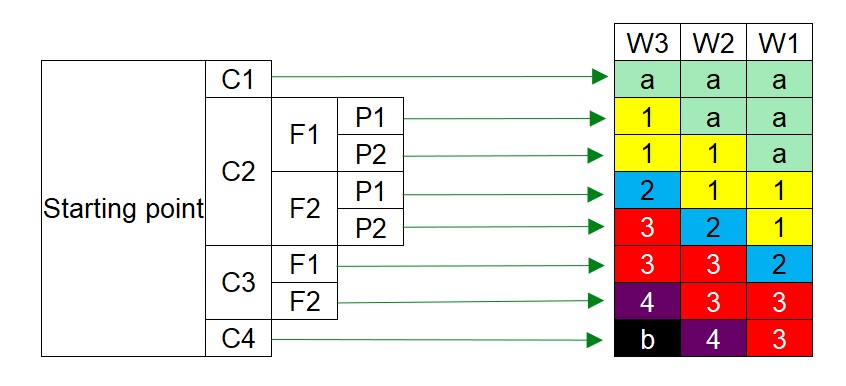
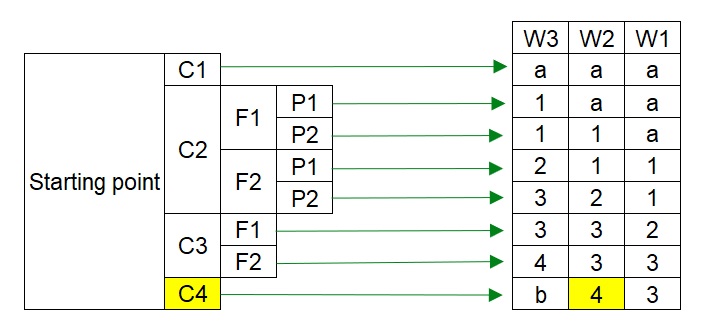
โดยตัวอย่างเกณฑ์การเลือกใช้ค่า Consequence Severity (C), Frequency of exposure (F), Potential of avoidance (P), และ Hazard Demand Rate (D) สามารถเลือกได้จากตารางข้างล่าง

1234
Consequence Severity (C)Minor injurySingle fatality1-3 Fatalities> 3 Fatalities
Frequency of exposure (F)< 2 hr/day> 2 hr/day
Potential of avoidance (P)PossibleDifficult
Hazard Demand Rate (D)< 1 year1-10 year> 10 years

หลังจากเลือกใช้ค่าต่างๆตามตารางแล้ว สามารถได้ระดับ SIL ไม่ว่าจะเป็น SIL-a, SIL-1, SIL-2, SIL-3, SIL-4, และ SIL-b

โดยที่ SIL-a มีความหมายว่า gap ของความเสี่ยงนั้น ไม่ได้สูงมากสามารถจัดการได้ด้วยระบบอื่นที่ไม่ใช่ระบบ Safety Instrumented System (SIS) เช่น ระบบ Basic Process Control System (BPCS)

และ SIL-b มีความหมายว่า gap ของความเสี่ยงนั้นมีความสูงมากๆ ไม่สามารถจัดการได้ด้วยระบบ Safety Instrumented System (SIS) เพียงระบบเดียว จำเป็นต้องมีระบบอื่นเข้ามาช่วย เช่น ระบบเครื่องกล Mechanical Device เช่น PSV เป็นต้น

ทั้งนี้ Risk Graph ของสิ่งแวดล้อม Environment และเครื่องจักร Asset จะมีความแตกต่างจาก Risk Graph ในรูป เพราะตัวแปรบางตัวจะไม่สามารถนำมาพิจารณาได้ เช่น Frequency of exposure (F), และ Potential of avoidance (P) เพราะสิ่งแวดล้อมและเครื่องจักรไม่สามารถหลบหนีจากอันตรายได้ และก็อยู่กับที่ตลอดเวลา

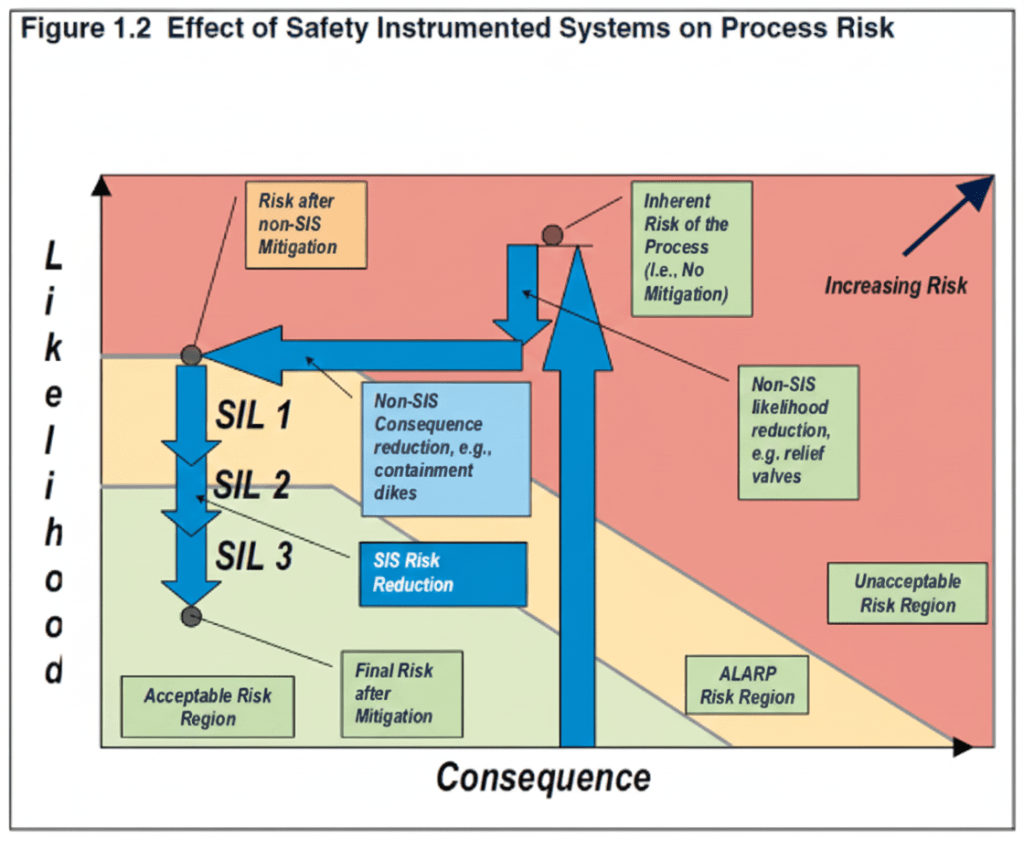
Layer Of Protection Analysis (LOPA) Method

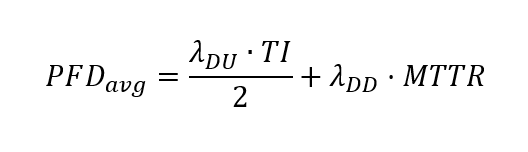
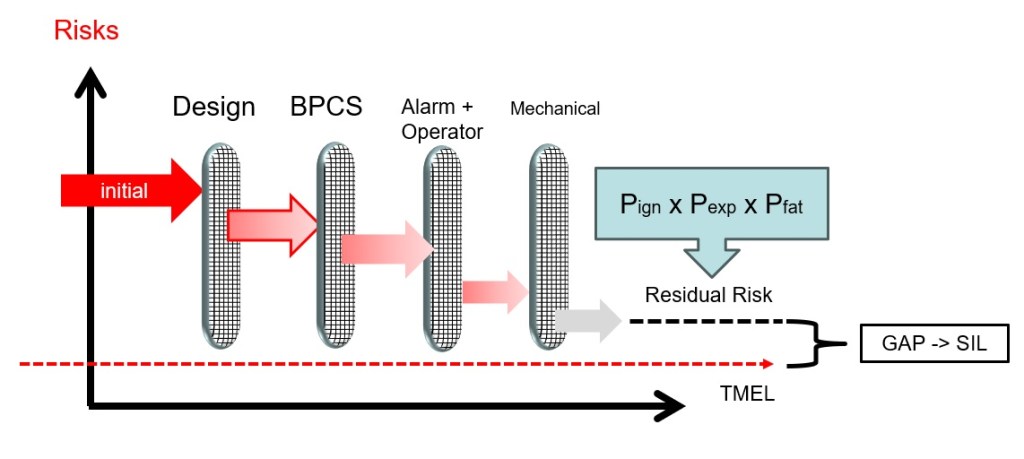
การวิเคราะห์ชั้นการป้องกัน หรือ Layer Of Protection Analysis (LOPA) เป็นอีกวิธีหนึ่งในการกำหนดระดับ SIL โดยการวิเคราะห์ว่าชั้นการป้องกันที่มีอยู่ หรือที่เรียกว่า Independent Layer Of Protection (IPL) ภายในระบบนั้นว่ามีเพียงพอที่จะลดความเสี่ยงของอันตรายให้ถึงระดับที่ยอมรับได้ หรือที่เรียกว่า Target Mitigated Event Likelihood (TMEL) หรือไม่

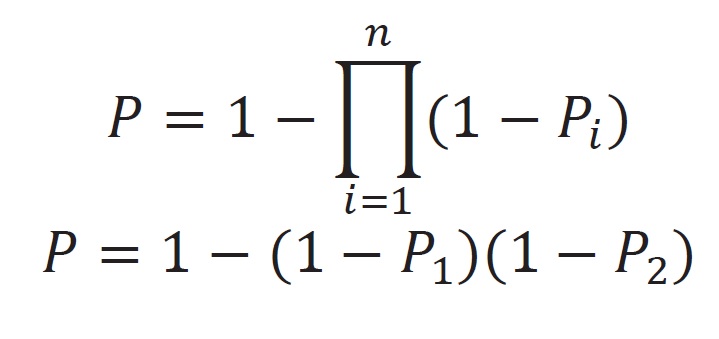
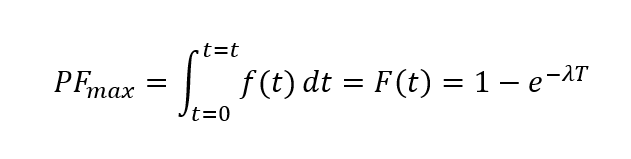
ผู้ใช้ที่ต้องการใช้วิธีการศึกษา Layer Of Protection Analysis (LOPA) ในการกำหนดระดับ SIL จำเป็นต้องมีความรู้เพิ่มเติมในวิชาคณิตศาสตร์ที่เกี่ยวกับความน่าจะเป็น ซึ่งนี่เป็นความจริงอย่างยิ่ง ที่ว่าไม่มีการป้องกันใดๆ ก็ตามที่จะสมบูรณ์แบบ 100% ยังไงก็มีความเป็นไปได้ที่จะล้มเหลวเมื่อมีความต้องการใช้งานอยู่ และนั่นคือประเด็นหลักของการศึกษา LOPA

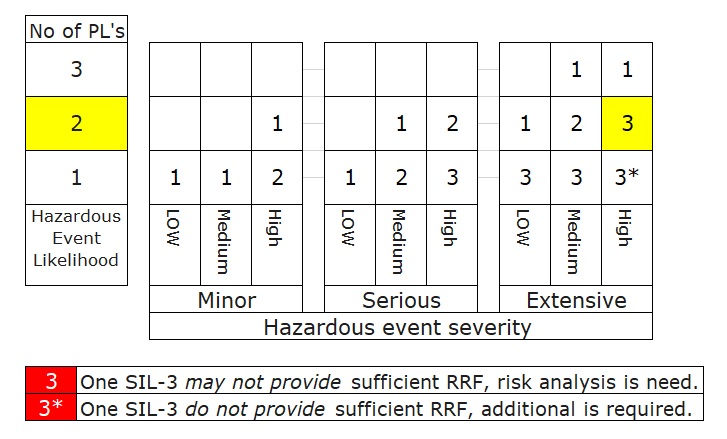
Hazardous Event Severity Matrix or Safety Layer Matrix (SLM)

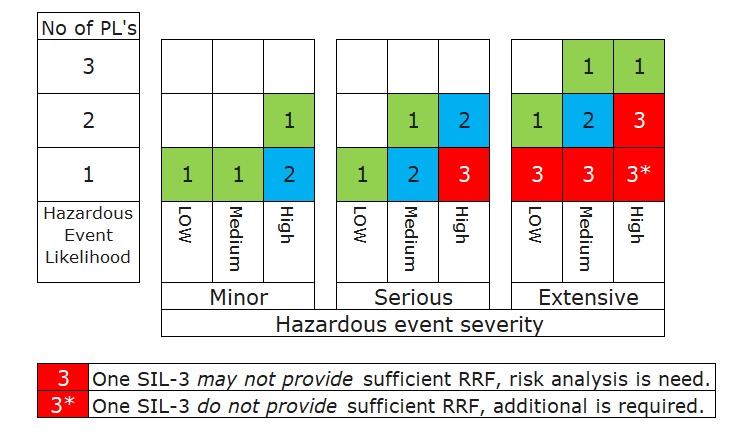
Same idea with the risk matrix, there is the other method to determine the SIL target by considering the available of the existing of protection layers which uses the qualitative way to identify the SIL target called Safety Layer Matrix (SLM).

Safety Layer Matrix (SLM) มีแนวคิดเดียวกันกับ Risk Matrix Method แต่ก็เป็นอีกวิธีหนึ่งในการกำหนดเป้าหมาย SIL โดยพิจารณาจากความพร้อมของชั้นป้องกันที่มีอยู่ ซึ่งใช้วิธีเชิงคุณภาพในการระบุเป้าหมาย SIL ตามตาราง Matrix ข้างล่าง

Results comparison

ตารางข้างล่างเป็นผลลัพท์การเปรียบเทียบหาระดับการป้องกันอันตราย Safety Integrity Level (SIL) ที่ต้องการ โดยใช้เทคนิค Risk Graph, Safety Layer Matrix, และก็ LOPA

Risk GraphSLMLOPA
Study characteristicsQualitative Qualitative Semi-Quantitative
Main Focus Finding the SILtargetFinding the SILtargetEnsure the risk is within tolerable level
Component
(Human)
– Demand rate
– Consequence Level
– Prob. of exposure
– Prob. of avoidance
– Number of Protection Later– Demand rate or initiating frequency
– Severity Level and TMEL
– Ignition Probability
– Potential of fatality
– Prob. of exposure
– PFD of IPL
Outcome SIL level: a,1,2,3,4, or bSIL level: a,1,2,3,4, or bSIL Level, PFD, and RRF
Time consumeLess LessMore
Conservative More MoreLess
NoteExcludes the existence of the protection. Excludes the precise value such as Pign, etcPFD value is subjective.

Example

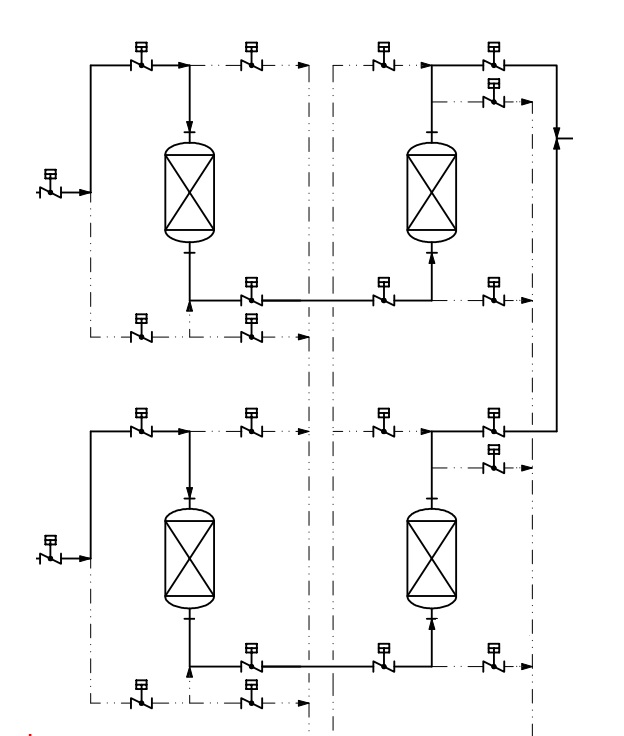
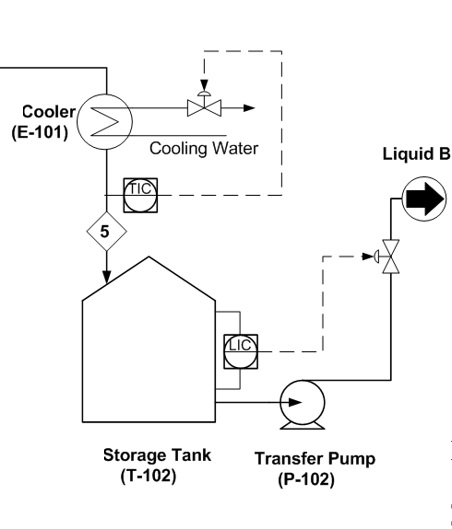
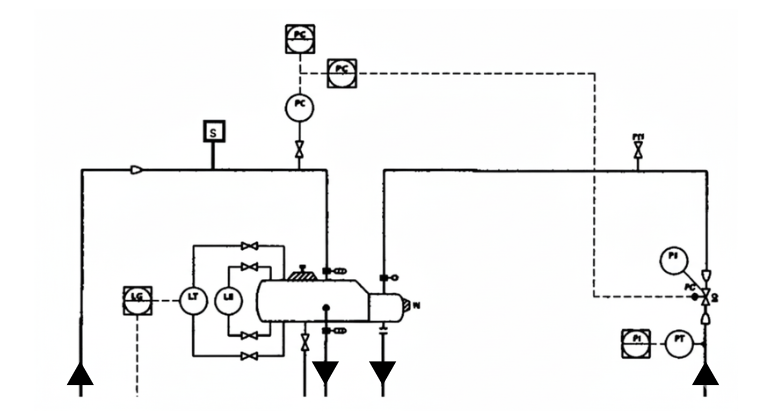
The ethylene evaporator is being considered for the additional Safety Instrumented Function to prevent overpressure scenarios. One potential cause of Loss Of Primary Containment (LOPC) is pressure control malfunction and wide opening of the pressure control valve (PV). This will lead to more of the HP steam supply to the Ethylene Evaporator, and potential of over temperature and over pressure in ethylene evaporator.

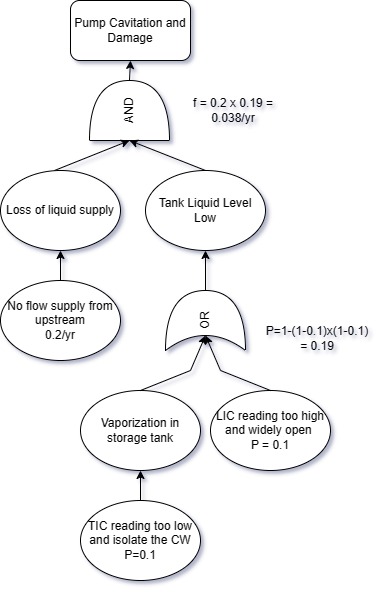
  • The frequency of failure (BPCS failure) is 1 in 10 year
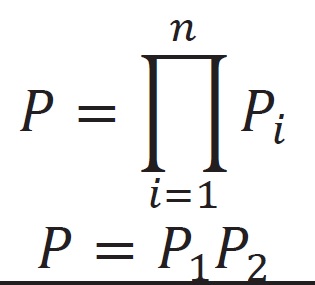
  • IPL is a Pressure Safety Valve (PSV) which can be considered as 2 credits of risk reduction. (PFD is 1E-2 per year)
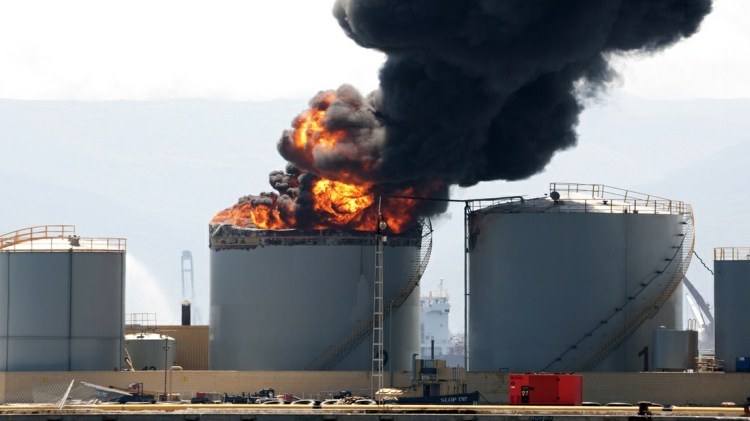
  • The severity level is C4 since the Ethylene will be released to the working area and fire if ignited and based on the company, the TMEL is 1E-6 per year.
  • The frequency of the operator accessing the location is approximately 15 mins/shift.
  • The probability of ignition of ethylene is 0.3

The result of the Risk Graph method is shown as SIL-4 is required. Since the maximum SIL level of process production is limited to the SIL-3 level, then an additional safeguard is required.

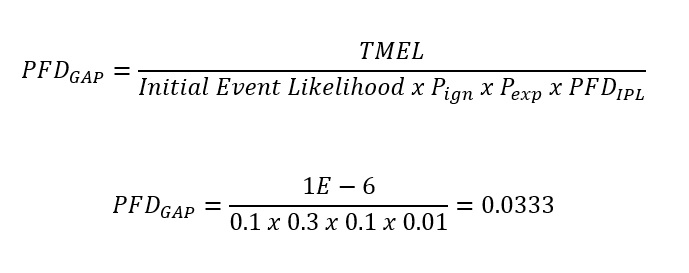
The result of the LOPA method is shown as SIL-1 is required. (RRF = 30.03)

The result of the Safety Matrix Layer (SLM) is shown as SIL-3 is required.

HAZOP Study for Batch Process

As you know the Hazard and Operability (HAZOP) is a structural and systematic examination of the complex process or system to identify and evaluate potential hazards and operability issues. It is commonly used in industries such as chemical, petrochemical, and nuclear process.

HAZOP can be applied to both continuous and batch processes, but there are some differences in how the studies are conducted to the nature of these processes. Below is the comparison between the continuous process and the batch Process.

SubjectContinuousBatch
Process DynamicsThe process operates continuously without interruption, The study focuses on the deviations from the normal operating. The process operates in a series of steps with intermittent periods of production.
Mode Normal, Start-up, and ShutdownMultiple phases/steps
Transient conditionLimit to only start-up, shutdown, and online mode changeAlways study the transient
Flexibility and VariabilityLimit to only some activities such as chemical loading More flexibility, especially Time-related guidewords
Time considerationLimit only 2 dimensions are (NO/LESS) and Extend (MORE).Many dimensions of Time-related deviation

From the above table, the main difference between the batch process and the continuous process is the process dynamics. The batch process will be discussed repeatedly in a series of steps. Hence, the workshop can become worse (discussion back and forth across the worksheet) if not well prepared.

Time-Related Guidewords of the Batch Operation

Below is an example of time-related guidewords that can be applied during the workshop, if relevant. However, it obviously be noticed those guidewords become more relevant when encompassed with human factors.

GuidewordInterpretation
Early/beforesomething errors and do something earlier than required.
Late/aftersomething errors and do something later than required.
Quickersomething errors and do something quicker than required.
Slowersomething errors and do something slower than required.
Repeated something errors and do something double.
Table of additional HAZOP Guidewords for the Batch HAZOP

Example

Below is an example of the Process Flow Diagram (PFD) of the Carbon Filter and Cation Filter in the Demineralized Water Package.

StageDescriptionService InletService OutletBackwash InletBackwash OutletRinse OutletVent
1Venting O
2Filling O
3Pre-Service RinseOO
4ServiceOO
5Back WashOO
6Final Rinse and DrainOOO

The HAZOP worksheet will look like this.

DeviationCause
No/Less FlowFailure and stuck closing of vent valve during the venting stage.
Failure and stuck closing of the serive inlet valve during Pre-Service Rinse
Failure and stuck closing of the service inlet valve during Rinse Outlet

The other way around is using the Failure Mode Effect Analysis (FMEA) study for 2 modes either open or closed failure mode during a review against all working steps.

Failure ModeSequenceConsequnce
Fail Close of Service InletVenting No safety issues as the system will understand it as a normal condition.
Filling Leading to No/Less flow of liquid supply to…
Pre-Service RinseLeading to No/Less flow of liquid supply to…
ServiceLeading to No/Less flow of liquid supply to…
Back WashNo safety issues as the system will understand it as a normal condition.
Final Rinse and DrainLeading to No/Less flow of liquid supply to…

In this way, all valves will be reviewed against all operation modes.

Safety Integrity Level (SIL) and Process Risk

SIL (Safety Integrity Level) คือ ระดับความน่าเชื่อถือของระบบความปลอดภัย ที่ใช้บ่งชี้ว่า ระบบนั้นสามารถลดความเสี่ยงจากอุบัติเหตุร้ายแรงได้มากน้อยเพียงใด โดยเป็นค่าที่กำหนดตามมาตรฐานสากล IEC 61508 และ IEC 61511 ซึ่งระบบที่กล่าวถึงเป็นระบบทำงานด้วยเครื่องมือวัด หรือ เรียกว่า Safety Instrumented System (SIS) ที่ใช้ลดความเสี่ยงของกระบวนการผลิต โดยทำงานผ่าน “ฟังก์ชันความปลอดภัยแบบใช้เครื่องมือวัด” หรือ Safety Instrumented Function (SIF) หลายฟังก์ชัน

SIS and Risk Reduction

Workflow แสดงความความต้องการใช้ Safety Instrumented Function (SIF) เป็น Risk Reduction

ความจำเป็นของการมี Safety Instrumented Function (SIF) ในระบบ Safety Instrumented System (SIS) ตั้งต้นจากการชี้บ่งอันตราย Hazard identified แล้วจะมีการประเมินความเสี่ยงด้วยวิธีต่างๆ เช่น Risk Ranking (Risk Matrix) หรือการประเมินเชิงปริมาณ Quantitative Risk Assessment (QRA) หรือการประเมินกึ่งเชิงปริมาณ Semi-Quantitative Risk เช่น ในระหว่างการศึกษา Layer Of Protection Analysis (LOPA)

ซึ่งในระหว่างนั้นเราต้องทำการเปรียบเทียบกับเกณฑ์ความถี่ที่ยอมรับได้ Tolerable Risk Acceptance Criteria ซึ่งถ้าพบว่าความเสี่ยงที่ได้ยังไม่อยู่ในเกณฑ์ที่ยอมรับได้ เราก็จำเป็นต้องมีระบบป้องกันเพิ่มเติม โดยตัวอย่าง ระบบป้องกันเพิ่มเติม ได้แก่

  • Basic Process Control System (BPCS)
  • Alarm and operator action
  • Mechanical Protection i.e. PSV
  • Safety Instrumented System (SIS)

จะเห็นได้ว่าจังหวะนี้ ระบบการหยุดเครื่องจักรอัตโนมัติด้วยเครื่องมือวัด หรือ Safety Instrumented System (SIS) จะเข้ามาเพื่อช่วยให้ความเสี่ยงของเราต่ำลงจนไปอยู่ในเกณฑ์ที่ยอมรับได้

Safety Integrity Level (SIL)

คำถามถัดไปคือการระบุ Performance requirement ของ Safety Instrumented Function (SIF) ที่อยู่ในระบบการหยุดเครื่องจักรอัตโนมัติด้วยเครื่องมือวัด หรือ Safety Instrumented System (SIS) ที่เรียกว่า Safety Integrity Level (SIL)

หรือกล่าวอีกนัยหนึ่งคือ การระบุ Safety Integrity Level (SIL) คือการบอกปริมาณหรือระดับความเสี่ยงที่ลดลง Risk Reduction ที่ต้องการเพื่อนำความเสี่ยงไปอยู่ในเกณฑ์ที่ยอมรับได้

โดย SIL จะมีด้วยกัน 4 ระดับ ตั้งแต่ SIL-1 จนถึง SIL-4 โดยที่ SIL-4 จะมีค่าสูงสุด (มีความสามารถสูงที่สุด) ดังนั้นแล้วถ้าความเสี่ยงยังมีความห่างกับเกณฑ์ที่ยอมรับได้สูง ก็ต้องพิจารณา SIL ที่มีระดับสูงเข้ามาใช้

จากตัวอย่างดังรูป ความเสี่ยงเริ่มต้น Inherent Risk อยู่ในพื้นที่ที่ยอมรับความเสี่ยงไม่ได้ Unacceptable Risk การเพิ่มเติมอุปกรณ์ เช่น Pressure relief valve จะทำให้ความถี่ (Likelihood) ลงลง และการมีระบบป้องกันการรั่วไหล Containment, dike จะสามารถลดความรุนแรง (Consequence) โดยเลื่อนจุดไปอยู่ทางด้านซ้าย

แต่ถ้าความเส่ี่ยงที่ได้ยังไม่อยู่ในเกณฑ์ที่ยอมรับได้ การเพิ่มระบบการหยุดเครื่องจักรอัตโนมัติด้วยเครื่องมือวัด Safety Instrumented System (SIS) เข้ามาก็สามารถเลื่อนจุดลงมาในแนวดิ่งจนถึงเกณฑ์ที่ยอมรับได้ Acceptable Risk Region ได้

จากตัวอย่าง เพิ่ม SIL-1 นำ Risk ไปอยู่ในช่วง ALARP Risk Region เพิ่ม SIL-2 นำ Risk ไปอยู่ด้านบนของ Acceptable Risk Region แต่ถ้าเพิ่ม SIL-3 สามารถลงมาลึกได้มากกว่า

ประสิทธิภาพหรือประสิทธิผลของ Safety Instrumented Function (SIF) ที่เรียกว่า SIL แสดงโดยความน่าจะเป็นที่จะเกิดความล้มเหลวเมื่อมีความจำเป็นต้องใช้ หรือ Probability of Failure on Demand (PFD) หรือจะเรียกได้ว่า ค่า PFD เป็นตัวชี้วัดที่ใช้ในการบอกความน่าเชื่อถือของฟังก์ชันความปลอดภัย ที่จะไม่ทำงานตามวัตถุประสงค์ได้เมื่อมีความจำเป็นต้องใช้ ดังแสดงตามตารางข้างล่าง

SIL LevelPFDavg (Low Demand)RRFPFHavg (High Demand)
1<10-1 to < 10-2>10 to 100<10-5 to < 10-6
2<10-2 to < 10-3>100 to 1,000<10-6 to <10-7
3<10-3 to < 10-4>1,000 to 10,000<10-7 to <10-8
4<10-4 to <10-5>10,000 to 100,000<10-8 to <10-9
SIL Level Table

ตีความได้ว่า ยิ่งมีค่า SIL สูงเท่าไร ระดับความน่าเชื่อถือของ SIF นั้นยิ่งสูงมากเท่านั้น (โอกาสที่จะเกิดฟังก์ชั่นเสียเมื่อมีความต้องการใช้งาน PFD มีค่าต่ำมากๆ)

จากตารางจะมีคำว่า “Low Demand” หมายถึง สถานการณ์ที่ฟังก์ชันความปลอดภัยหรือระบบเครื่องมือความปลอดภัยถูกเรียกใช้งานไม่บ่อยนัก เช่นปีละครั้ง หรือหลายๆปีครั้ง หรือก็คือ ความถี่ในการเกิดเหตุการณ์หรืออุบัติเหตุไม่บ่อยมาก เช่น ในโรงงานปิโตรเคมี เป็นต้น

กลับกัน คำว่า “High Demand” หมายถึง สถานการณ์ที่ฟังก์ชันความปลอดภัยหรือระบบเครื่องมือความปลอดภัยถูกเรียกใช้งานบ่อยครั้งหรืออย่างต่อเนื่อง หรือเป็นฟังก์ชั่นด้านความปลอดภัยที่ต้องใช้งานตลอดเวลา เช่น เครื่องบิน โดยจะมีการเปลี่ยนเทอมการเรียกจาก Probability of Failure on Demand (PFD) เป็น Probability of Failure per Hour (PFH)

SIS, SIF, and SIL

สรุปได้ว่า “ระบบความปลอดภัยแบบใช้เครื่องมือวัด” หรือ Safety Instrumented System (SIS) คือระบบความปลอดภัยโดยรวมที่ครอบคลุม “ฟังก์ชันความปลอดภัยแบบใช้เครื่องมือวัด” หรือ Safety Instrumented Function (SIF) หลายฟังก์ชัน แต่ละ SIF ได้รับการออกแบบมาเพื่อจัดการกับอันตรายเฉพาะ และได้รับมอบหมาย “ระดับความสมบูรณ์ด้านความปลอดภัย” หรือ Safety Integrity Level (SIL) ตามการลดความเสี่ยงที่ต้องการ ความสัมพันธ์สามารถสรุปได้ดังนี้ SIS > SIF > SIL โดยที่ SIFs เป็นส่วนประกอบของ SIS และ SIL เป็นมาตรการที่กำหนดให้กับ SIF แต่ละรายการ

SISSIFSIL
ScopeEntire systemSpecific function
ComponentOverach SIFSensor+Logic solver+Final Element
FunctionManage overallImplement a specific function
Measurement1, 2, 3, or 4

Markov Modeling for SIL Verification

Markov modeling is a mathematical modeling technique used to analyze and describe systems that undergo transitions between different states over time. Markov modeling is beneficial in reliability analysis for several reasons. It provides a systematic and mathematical approach to understanding the behavior of the system.

Benefit

State-Based Representative: Markov models allow the representation of a system’s reliability in terms of different states such as Operational State (Up), Failed State (Down), and Degraded State.

Dynamic Analysis: Markov models are particularly useful for systems with dynamic behavior, where transitions between states occur over time. This is valuable in analyzing complex systems where the reliability may change on the operational conditions, maintenance activities, or external factors.

Quantitative Analysis: The Markov models enable the quantitative assessment of the reliability of the system. It can be used to determine the steady-state availability, expected number of transitions, and mean time to failure.

Flexibility in Modeling: Markov models can be adapted to model various types of systems, including repairable and non-repairable systems.

Handling Complex System: Markov models are effective in handling complex systems with multiple components and failure modes. The model can be expanded to include various subsystems and interactions.

Sensitivity Analysis: Markov models allow for sensitivity analysis to identify critical components or states that significantly impact system reliability. This information is valuable for prioritizing resources.

Markov Modeling Steps

  • Define States: Identify and define the different states of the system can be in such as operational, degraded, and failed.
  • Establish Transition Probability: Determine the probabilities of transition from one stage to another. These transition probabilities are typically presented by a transition probability matrix (P), where Pij is the probability of transitioning from state i to stage j.
  • Create a Transition Diagram or Matrix: Develop a visual representation of the Markov model using a state transition diagram or matrix.
  • Define Initial State Probabilities: Specify the initial probability of the system being in each state at the start of the analysis. This information is represented by an initial state probabilities vector or transitioning vector.
  • Evaluate Steady-State Probabilities: Determine the steady-state probabilities, which represent the long-term probabilities of the system being in each state.
  • Calculate System Metrics: Once the steady-state probabilities are known, various system reliability metrics can be calculated such as mean time to failure (MTTF), and expected number of transitions between states.
  • Sensitivity Analysis: Conduct sensitivity analysis to understand the impact of changes in transition probabilities on the overall system reliability. This will involve varying transition probabilities and observing their effects on the system metrics.

Markov Simple Transition Diagram

The simple of the Markov two-state transition and matrix are below. The states are “Operational (O)” and “Failed (F)”. The transition probability between these states is represented by a transition probability matrix (P).

  • 1-POF is the probability of staying in the Operational State;
  • POF is the probability of transitioning from Operational to Failed State;
  • 1-PFO is the probability of staying in the Failed State;
  • PFO is the probability of transitioning from a Failed State to the Operational; and 
The P-Matrix: Transition Probability Matrix

Example: Steady-State Availability

A repairable transmitter with one failure has a probability that the transmitter will fail 0.1 and once the failure is detected, the probability of the repair and recovery is 0.8. The Markov transition and matrix are the following. What is the Steady-State Probability? What is the Steady-State Availability?

There are three mathematical ways to calculate the Steady-State Probability. Below shown the P matrix can be multiplied by itself to get the transition probabilities matrix.

The second way is the way to take account of the starting state that contributes to time-dependent probabilities.

State Probability Time Interval

Time IntervalState OperationState Failed
00.90.2
10.890.12
20.8890.112
30.8890.111
40.8890.111

The last stage is known as the limiting state probability or Steady-Stage Probability which the top and bottom rows of the limiting state probability matrix are the same numbers. And the Steady State of Availability is 0.889.

The third method used the direct algebraic method which offers the quickest solution to Limiting State Probability or Steady State Probability State. This technique is called the “regular” Markov model.

Fault Tree Analysis (FTA) for System Reliability Analysis

Fault Tree Analysis (FTA) is a systematic and graphical method used for analyzing the cause of a system failure and system reliability. In the Fault Tree Analysis, a top event or system failure is identified, and the possible contributing factors and events leading to that failure are systematically analyzed and represented in a tree-like diagram.

The diagram consists of logical gates (AND, OR, and NOT) and events that contributed to the top event. The event vents are connected in a way that presents the relationships between particular part and their impact on the overall system failure.

The main components of a Fault Tree include:

  • Top Event: The undesired event or system failure that is being analyzed such as failure of control function, failure of safety instrumented function, equipment failure, or etc.
  • Basic Event: The lowest level events in the tree that cannot be broken down further. These events are considered as cause of the top event.
  • Logical Gates: Below are typical gates that are used in Fault Tree Analysis (FTA)
Gate TypeInterpretation
ANDEvents that must occur together for the next event to occur
OREvents where any one or more can cause the next event to occur

Advantages and Disadvantages

The Advantages of Fault Tree Analysis are the following;

  • Systematic Approach: FTA provides a systematic and structured approach to analyzing the cause of system failures.
  • Visual Representation: FTA provides a visual representation of the potential failure modes and their relationships which allows for the identification of critical paths and weak points in a system, helping organizations prioritize resources for risk mitigation.
  • Decision Support: FTA is an effective tool for the Route Couse Analysis (RCA) and Common Cause Analysis (CCA) studies by breaking down a complex system into its basic events.

The disadvantages of Fault Tree Analysis are the following;

  • Simplicity Assumption: FTA relies on certain assumptions, such as each basic event is independent. In reality, events may be correlated.
  • Data Requirement: FTA requires quantitative data for probabilities and failure rates. Obtaining accurate and reliable data can be challenging, especially for rare events.
  • Complexity: For the complex system. FTA can become very intricate and difficult to manage as the number of events and branches increases.
  • Dynamic Situation: FTA is primarily a static analysis tool, and it may not capture the dynamic nature of the interactions and dependencies of some events that may change over time such as frequency maintenance can be subject to reduce equipment failure.
  • Subjectivity: The process of assigning probability value to events in FTA can be varied by different analysts.

Comparison

If comparing the Fault Tree Analysis (FTA) method with the other reliability study method, the results can be presented as the following.

StudyFocus
Event Tree Analysis (ETA)Analyze the consequences rather than probability as the FTA does.
Failure Mode and Effect Analysis (FMEA)FMEA is often used for more detailed analysis and qualitatively focuses on the component’s failure modes and their effects.
MakovMakov can provide an advance in a dynamic situation since it focuses on the probabilities of transitioning between different states of a system over time
Reliability Block Diagram (RBD)RBD is often used for less complex.
Monte Carlo Monte Carlo incorporates the probabilistic inputs and variation, providing a more realistic.
Bayesian NetworkBayesian networks can model probabilistic dependencies among a set of variables which can provide more flexibility in handling complex relationships.

Calculation

For events connected by an AND gate, the overall probability is calculated using the multiply function from individual probabilities.

For events connected by an OR gate, the overall probability is calculated using the complement rule. The complement of the event not occurring is subtracted from 1.

Example

To analyze the frequency of flammable hydrocarbon pump cavitation and damages by loss of the liquid supply from the upstream process is approximately 0.2/year and the probability of malfunction of BPCS control loops such as cooldown temperature control loop (TIC) and storage tank level control loop (LIC) is 0.1.

To draw the FTA diagram, we will use the Top-Down technique.

HAZOP Study

The Hazard and Operability Study (HAZOP) is a structured and systematic examination of a complex process or system to identify and evaluate potential hazards and operability issues. It is commonly used in industries such as chemical, petrochemical, nuclear, and pharmaceutical to assess the safety and reliability of processes.

HAZOP studies are an integral part of the overall Process Safety Management (PSM). The insights gained from a HAZOP study contribute to the design, operation, and safety maintenance and reliable process.

The primary objectives of a HAZOP study are:

  1. Identify Hazards;
  2. Evaluate Consequences;
  3. Determine Potential Causes;
  4. Recommend Mitigation Measures

HAZOP Study Workflow

  1. Selecting the study team: A multidisciplinary team, including individuals with expertise in process engineering, operation, safety, and other relevant fields is assembled.
  2. Defining the Study Objectives and Scope: The team establishes the boundaries and objectives of the HAZOP study, defining the specific aspects of the NODE, process or system to be examined.
  3. Conducting the Study: The team systematically reviews the process using “guidewords” (such as “more”, ”less”, “no”, “as well as”, etc.) to explore potential deviation from the normal operating condition.
  4. Identify the Deviation: Deviation and potential hazards shall be identified by the participants. The prompt application of each guideword may be used.
  5. Assessing Consequences: The team evaluates the consequences of each identified deviation without considering the validation of the safeguards in the first place.
  6. Assessing the existing safeguards: The design team supports identifying the available safeguards that exist to prevent the hazardous likelihood or mitigate the consequence.
  7. Explore further risk reduction by recommendation: Based on the analysis, the team suggests recommendations and measures to further mitigate or eliminate the identified hazards and improve operability.
  8. Preparing a HAZOP report: The findings and recommendations are compiled into a comprehensive report, which serves as a valuable reference for improving the safety and efficiency of the process.

Challenges associated with the HAZOP study

  • Limited to Design Stage: HAZOP studies are typically conducted during the design stage or modification of the process. This means that some potential hazards and some operability issues may not be identified such as changes in operating conditions, or changes of personnel.
  • Subjectivity: The effectiveness of a HAZOP study is highly dependent on the expertise and experience of the study team. Different teams may identify different potential issues based on their individual perspectives.
  • Focus on Process Deviation: The HAZOP studies primarily focus on deviations from normal operating conditions. While this is valuable for identifying potential hazards, it may not comprehensively address all types of risks, such as external factors or rare events that fall outside the scope of normal deviation.
  • May not address Human Factors: The HAZOP study may not fully address human factors, such as human error or the impact of operator actions on process safety. Human factors are the main key factors to contribute safety measures and mitigating risk.
  • Limited Quantitative Analysis: The HAZOP study is a qualitative analysis method, and it does not provide a quantitative assessment of risk.
  • Limited Coverage of System Dynamics: HAZOP focuses on individual nodes or components of a system. It may not fully capture the dynamic interactions.

Example credible scenario

Credible ScenarioExample
A single human errors Incorrect operating sequence,
Prolonged or excessive cycles
A single instrument or mechanical failurePump trips,
Malfunction of controller

Example incredible scenario

Incredible ScenarioExample
Simultaneous failure of two independent instrumentMalfunction of two controller
Failure of both relief devicesPSV-1, and Rupture Disc are stuck close.
Failure of the controller and the PSV fails to operate Pressure control malfunction and PSV stuck close

Hazard Identification (HAZID) study for Offshore Exploration and Production

HAZID study คืออะไร

HAZID ย่อมาจาก Hazard Identification เป็นกระบวนการเชิงที่ใช้ในอุตสาหกรรมต่างๆ เพื่อระบุอันตรายที่อาจเกิดขึ้นที่เกี่ยวข้องกับระบบ กระบวนการการทำงาน Production หรือกิจกรรมงานต่างๆ เช่น Start-up, Commissioning, Decommissioning เป็นต้น

ดังนั้นการศึกษา HAZID ให้ประโยชน์หลายประการ ซึ่งช่วยเพิ่มความปลอดภัย การจัดการความเสี่ยง และความสำเร็จโดยรวมของโครงการ ข้อดีหลักบางประการของ HAZID ได้แก่;

  • ลดความเสี่ยงที่รุนแรง
  • เพิ่มความปลอดภัย
  • เป็นไปตามแนวปฏิบัติที่ดีที่สุด (Best Practice)
    • ในประเทศไทยและสากล HAZID study แม้ไม่ได้เป็นกิจกรรมที่กฏหมายบังคับให้ต้องทำโดยตรงเสมอไปแต่มักเป็นส่วนหนึ่งของการเตรียมข้อมูลเพื่อการทำ PHA ตาม 29 CFR 1910.119(d) ตาม OSHA PSM และใน API และ ISO Standards หลายฉบับก็แนะนำหรือกำหนดให้ทำ HAZID ในโครงการที่มีความเสี่ยงสูง เช่น โรงกลั่น, โรงงานเคมี, หรือ offshore
  • การประหยัดค่าใช้จ่าย
  • ช่วยในการตัดสินใจที่ดีขึ้น Enhanced Decision-Making
  • ช่วยเพิ่มความมั่นใจของผู้มีส่วนได้ส่วนเสีย Stakeholder Confidence
ความต้องการใช้ HAZID study เป็นเครื่องมือในการหา Process Safety Information (PSI) ซึ่งเป็นหนึ่ง PSM Key Element ใน 29 CFR 1910.119(d)

HAZID Study Workflow

  1. Define the scope: ระบุวัตถุประสงค์และเป้าหมายของการศึกษา HAZID กำหนดขอบเขตและขอบเขตของการศึกษา รวมถึงระบบ กระบวนการ หรือกิจกรรมการทำงาน
    • ยกตัวอย่างเช่น Standard HAZID guidewords ตาม ISO-17776 Petroleum and natural gas industries – Offshore Production Installation ก็จะกำหนดการใช้กับอุตสาหกรรมหลักๆเช่น
      • แท่นขุดเจาะกลางทะเลแบบอยู่กับที่ Fixed offshore structures
      • เรือที่ใช้บรรทุกสาร hydrocarbon หรืออาจจะมีส่วนการผลิตรวมอยู่ด้วย Floating production, storage and take-off system
  2. Assemble a multidisciplinary team: สร้างทีมที่มีสมาชิกที่มีประสบการณ์จากสาขาที่เกี่ยวข้องต่างๆ เช่น Process Engineer, Production Engineer, Project Engineer, Layout Engineer, เป็นต้น
  3. Brainstorm and identify the hazardous scenarios: ระดมความคิดและระบุสถานการณ์อันตรายที่อาจเกิดขึ้นที่เกี่ยวข้องกับระบบหรือกระบวนการ
  4. Identify the existing safeguards in place: ระบุมาตรการป้องกันที่มีอยู่แล้วในระบบ ซึ่งสามารถป้องกันสถานการณ์และบรรเทาผลกระทบ รวมถึงการออกแบบและการควบคุมทางการบริหาร
  5. Risk Ranking and Prioritize hazards: ประเมินความรุนแรงและความน่าจะเป็นของสถานการณ์อันตราย
  6. Document Results: บันทึกสมมติฐาน รายงานการประชุม ระบุอันตรายที่ที่ทำการวิเคราะห์ มาตรการป้องกัน การจัดอันดับความเสี่ยง ข้อเสนอแนะ และการประเมินของทีม
  7. Review and Validation: ทบทวนผลการศึกษาของ HAZID กับผู้ที่เกี่ยวข้อง และตรวจสอบความถูกต้องของผลการศึกษาและให้แน่ใจว่าพิจารณาความเสี่ยงที่ระบุทั้งหมดแล้ว
  8. Develop the risk management plan: สร้างแผนจัดการความเสี่ยง โดยระบุมาตราการในการบรรเทาหรือควบคุมความเสี่ยง จัดลำดับความสำคัญของงานตามระดับความเสี่ยงและผลที่อาจเกิดขึ้นจากรุนแรงมากไปน้อย
  9. Implementation and monitoring: ดำเนินการตามมาตรการลดความเสี่ยงและจัดตั้งกระบวนการติดตามและตรวจสอบเพื่อให้แน่ใจว่ามีประสิทธิภาพอย่างต่อเนื่อง

Other HAZID Techniques

อย่างที่กล่าวไว้ข้างต้น HAZID เป็นแค่คำที่ถูกนิยามขึ้นมาเพื่อหาหรือชี้บ่งอันตรายต่างๆของโครงการ ทั้งนี้การเลือกวิธีการชี้บ่งที่เหมาะสมจะขึ้นกับบริบท (context) รอบด้านต่างๆ แต่อย่างไรก็ตามทาง 29 CFR 1910.119(d) ได้ระบุเทคนิคที่นิยมใช้ต่างๆไว้ดังนี้

เทคนิตต่างๆที่ถูกแนะนำในการใช้เพื่อชี้บ่งอันตรายจากอุตสาหกรรมประเภทต่างๆ และลักษณะงานต่างๆ

Checklist: ใช้รายการตรวจสอบที่กำหนดไว้ล่วงหน้า (pre-defined checklist) เพื่อระบุอันตรายทั่วไป

What-If Analysis: ประเมินสถานการณ์ที่เป็นไปได้และตั้งคำถาม “ถ้าเกิดว่า”

HAZOP (Hazard and Operability Study): ตรวจสอบการออกแบบและการดำเนินงานของระบบอย่างเป็นระบบเพื่อระบุความเบี่ยงเบนที่อาจนำไปสู่ความเสี่ยงผ่านการใช้คำ Guidewords มาตราฐาน No, More, Less

FMES (Failure Modes and Effects Analysis): การวิเคราะห์โหมดการล้มเหลวที่อาจเกิดขึ้นของส่วนประกอบต่างๆหรือทั้งระบบ

HAZID Guidewords

ISO 17776 is “Petroleum and Natural Gas Industries – Offshore Production Installations – Major Accident Hazard Management during the Design of New Installations” ใน Annex F, จะมี HAZID guidewords เช่น Hydrocarbon, Explosives, Pressure Hazards, Hazard associated with differences in height, Toxic gas, Toxic fluid, Toxic solid, และอื่นๆ

Offshore HAZID Challenges

Challenge ที่เกี่ยวกับความอันตรายของสาร Hydrocarbon

  • พื้นที่แคบและในระบบมีแรงดันสูงอยู่หลายจุด
  • หากเกิดการรั่วไหลอาจทำให้เกิดไฟไหม้หรือระเบิดได้อย่างรวดเร็ว
  • บางจุดเข้าไปตรวจสอบหรือปิดวาล์วได้ยาก

แนวทางการแก้ไข:

  • ใช้ระบบตรวจจับก๊าซ (Gas Detectors) พร้อมระบบ Shutdown อัตโนมัติ (ESD) โดยศึกษา fire & gas mapping ให้ครอบคลุมพื้นที่เสี่ยง
  • ออกแบบระบบระบายอากาศและระบายแรงดัน (Pressure Safety Valve) อย่างเหมาะสม
  • ซ้อมแผนอพยพและตอบโต้เหตุฉุกเฉินอย่างสม่ำเสมอ

Heat Recovery Steam Generator (HRSG) Safety

HRSG is a device used in power plant to recover waste heat from exhaust gas of a Gas Turbine (GT), Gas Engine Generator (GEG), or other combustion system. The HRSG will convert the heat energy from exhaust gases and uses it to produce the steam, which can further be used to drive a Steam Turbine (ST) to generate additional electricity.

Main Components

A HRSG is a complex piece of equipment designed to recover waste heat from the combustion system. It typically consists of Evaporator, Superheater, Economizer, Steam Drum, Feed Water System, Auxiliary Burner, Stack, Exhaust flue gaseous, and Control System. The purpose of each component is explained below.

Evaporator: The evaporator is a component which is used to generate steam. It contains a series of heat exchange surfaces, usually in form of tubes.

Superheater: The superheater is responsible for further increasing the temperature of the steam produced by the evaporator to a superheated level which is suitable for driving a steam turbine.

Economizer: Economizer is positioned at the inlet of the HRSG to preheat the feedwater before it enters the evaporators. Thus, this unit helps to improve the overall efficiency of the HRSG.

Steam Drum: The steam drum is a vessel where the generated steam is collected before it is distributed to the downstream process. It also serves as a separator to remove any remaining water droplets from the steam.

Auxiliary Burner: In some HRSGs are part of a combined cycle power plant, the burners are installed to provide additional heat input when required such as during maintenance of gas turbine.

Hazards of HRSG

Overpressure: At the downstream of the HRSG, there is the Main Steam Stop Valve or MSSV which its play role as to control the rate of steam flow into the steam header. Hence, in case of the mis-operate failure of opening the MSSV during normal operation, the HRSG can experience with excessive pressure.

Overheating and damage: Without a proper water supply to the HRSG or low level in the steam drum, HRSG may experience of the deterioration of materials such as tubes and other components within the HRSG. This will lead to cracking and leakage.

Liquid carryover: In the opposite scenario, if lack of level control and high liquid inside the steam drum, foaming can be generated, and liquid can carryover the downstream equipment. This will lead to the water hammer in piping system and damages the steam turbine.

Fire and explosion: Unburnt exhaust gas can accumulate inside the exhaust stack if insufficient of performing the purging activity. It may lead to the internal fire and explosion if ignited.

Corrosion and Fouling: Also, unburnt exhaust gas can contain corrosive elements and particular matters. If these gases accumulation or contact with the low surface temperature part, they can contribute to the formation of corrosion and fouling.

Corrosion and Fouling: In the waterside, if lack of control the water control qualities such as fails to open blowdown system. It will lead to the accumulation of dissolved solids, sediments, scale formation and other impurities in the boiler water. Potentially causing of promote the corrosion.

Emission Compliance Issues: Unburnt exhaust gases may contain pollutants such as carbon monoxide, which can contribute to air quality concerns and environmental compliance issues.

Design Code

ASME Boiler and Pressure Vessel Code (BPVC): ASME BPVC includes not only design code but also safety standards for the operation of boilers, pressure vessels, including HRSG.

  • PG-70: Capacity of Pressure Relief Valve;
  • PG-72: Operation of Pressure Relief Valve
  • PG-73: Minimum Requirement for Pressure Relief Valves

Specific section of the ASME BPVC, such as Section I (Rules for Construction of Power Boilers), and Section VIII (Rules for Construction of Pressure Vessel)

  • UG-126: Pressure Relief Valve
  • UG-128: Liquid Pressure Relief Valve

NFPA 85 – Boiler and Combustion System Hazards Code

  • This code may be applicable to HRSG safety, particularly regarding combustion safety and fuel system.

Key Variables for SIL Verification Study

Safety Integrity Level (SIL) Verification is a crucial aspect of the functional safety lifecycle of the Safety Instrumented System (SIS) in the process industry. It involves a systematic and thorough assessment to confirm that the Safety Instrumented Function (SIF) within a system meets the target SIL.

The SIL and Probability of Failure on Demand (PFD) and closely related concepts in the context of SIS. The PFD is a quantitative measure used in this process to evaluate the reliability of SIS.

The goal of SIL verification is to ensure that the SIS is capable of reducing the risk associated with hazardous events to an acceptable level.

The key variables for SIL Verification are failure rate, Mission Time, Proof Test Interval (PTI), Proof Test Coverage factor (PTC), and Mean Time To Restore (MTTR)

1. Failure Rate

The failure rate, often denoted as the lambda symbol in Greek, is a measure used in reliability engineering to quantify the likelihood of a component or system failure within a specific period. It represents the number of failures per unit of time.

The relationship between failure rate and the probability of failure depends on the specific mathematical model used to describe the distribution of failure over time. One common model for the electronic device is the exponential distribution, which assumes a constant failure rate.

In the context of the exponential distribution, the probability density function (PDF) for time to failure (t) is given by:

The cumulative distribution function (CDF) is the representative of the probability of failure occurring before or at a specific time (t) is given by:

The probability of failure average of a single component is given by:

2. Proof Test Interval (PTI)

A proof test (TI) is a scheduled test or inspection conducted to ensure the SIS components are still capable of performing their safety function effectively. The purpose of proof testing is to detect and prevent undetected failures that could compromise the reliability of the system.

More frequent proof testing reduces the time between tests, increasing the chances of identifying and correcting potential failure promptly.

on the other hand, less frequent proof testing extends the time between tests, reducing the chances of identifying the failure results to higher the PF.

3. Proof Test Coverage (Cpt)

Proof Test Coverage is a measure of how well the proof testing activities can detect potential failure within the SIF. It is expressed as a percentage and is calculated based on the ability of the proof test to identify and address different failure modes. The formula for Proof Test Coverage is:

The number of failures detected and non-detected can be found in the detailed FMEDA analysis report of each device.

4. Mission Time (MT) or Life Time (LT)

Mission Time is a period during which SIFs are serviced. This value corresponds to the period between each major shutdown and overhaul or replacement of all equipment.

When taking into account the mission time, the probability of failure on demand average of a single element is changed to more precious as:

5. Mean Time To Restore (MTTR)

MTTR means the time at which a SIF is not providing protection for a process. MTTR is the time to detect the failure, time spent before starting the repair, effective time to repair, and time before re-service (installation, testing, etc). Hence, MTTR includes both mean detection time (MDT) and mean repair time (MRT).

Anyhow, the terms MDT and MRT vary depending on the detection mechanism and process condition during testing as follows.

Mean Detection Time (MDT)

Detection MechanismMDT
Automatic DiagnosticsDTI/2
Manual Proof Test during shutdownTI/2
Manual Proof Test with process operatingTI/2+PTD
Undetected by automatic diagnostics or manual proof testMT/2

Where the PTD is the Proof Test Duration

Mean Repair Time (MRT)

Process ConditionMRT
Process shutdown during repair0
Process operating during repairMRT

When taking into account the MTTR, the probability of failure on demand average of a single element is changed to more precious as:

Gas Engine Generator (GEG) Safety

A gas engine generator or GEG, also known as a genset or gas generator set, is a machine equipment that converts fuel into electrical energy using an internal combustion engine coupled with an electric generator.

Main Components of Gas Engine Generator

The specific components can vary depending on the type and size of the generator, but here are the main components commonly found in gas engine generators.

  1. Engine: Primary component responsible for converting the internal heat energy into mechanical energy.
  2. Turbocharger: From the picture above, it is a turbocharger with one radial turbine stage and one radial flow compressor stage. The function of the turbocharger rotor by convert the exhaust gases into energy. Simultaneously, it will draw the fresh air and compress it into compressed air.
  3. Alternator or Generator: Secondary component responsible for converting the mechanical energy to electrical energy.
  4. Fuel System: The purpose of the fuel system is to deliver the fuel and mix the fuel with air before combustion.
  5. Cooling System: A cooling system is necessary to maintain the engine’s temperature within a safe range. (e.g. intercooler)
  6. Lube Oil or lubricating system: It serves several essential purposes in machinery. (e.g. friction reduction, wear protection, heat dissipation, Corrosion prevention, sealing, etc.)
  7. Air Intake System: The intake air is regulated by the throttle which controls the amount of air entering to engine. The throttle control is essential for managing engine power.
  8. Exhaust System: The exhaust system is responsible for guiding the exhaust gaseous after combustion out of the engine safely.
  9. Governor: The governor is a control system that regulates the speed of the engines. It adjusts the fuel supply to maintain a constant speed under varying load conditions, ensuring a stable and reliable power output. Governor is commonly used in engines to prevent overspeeding scenarios.
  10. Bypass valve: Also known as a wastegate regulator, is a valve that controls the flow of gases in a system. A bypass valve is often associated with turbochargers. It controls the amount of exhaust gases that bypass the turbine, regulating the speed and pressure of the turbocharger.

Type and application of Turbocharger

The different types of turbochargers impact power generation in various ways. Each type has its unique characteristics and advantages. Here’s a brief overview of each type of turbocharger.

Single Turbo– Used in a wide range of applications;
– Efficient for providing a power boost, at high speed engine;
– Exhibit some turbo lag at the lower speed.
Twin Turbo– Uses to increase power output in larger engines;
– Improve responsiveness across a boarder range of engine speeds.
Sequential – Aim to address turbo lag issues;
– Commonly used in diesel engines;
– Uses two turbos, a smaller turbo provides quick response at low-speed and a larger one takes over at higher speed.
Twin-scroll– Help optimize exhaust gas flow by dividing the inlet passages;
– Enhance power generation, especially at lower engine engine speed

Design Codes and International Standards

NFPA 37: Standard for installation and use of stationary combustion engines and gas turbines e.g. gas trains for engines shall contain at least the following safety components: an equipment isolation valve, a regulator, and two automatic safety shutoff valves. [NFPA 37 – 5.2]

Hazard of Gas Engine Generator

  1. Fire and Explosion: Any leakage or malfunction in the fuel system and loss of containment can lead to fire or explosion hazards.
  2. Equipment damages: One of the most significant consequences is the risk of over-boosting and over-speeding if the bypass valve of the turbocharger fails in the closed position.
  3. Loss of production: Too much or air or fuel supply to cylinder or inadvertently close of fuel solenoid valve to cylinder will result in wrong fuel-air ratio and misfiring. This will lead to equipment stop (knocking).
  4. Exhaust Emission: GEG produces exhaust gases that can be harmful if inhaled. Exhaut gas with the dangerous constitutes NOx, SO2, CO, HC2, and soot are a particularly dangerous gas produced during combustion which can result in Noxious. (Negative effect on the environment)
  5. Electrical Hazards: There is a risk of electrical shock or electrocution if electrical resistance insulation loses integrity.
  6. Hot surfaces: The engine and accessories can become very hot during operation.
  7. Mechanical Hazards: Moving parts in the generator can pose a risk of injury if not properly guarded.
  8. High Pressure Hazards: GEG during start-up needs to use the compressed air since it is required to overcoming the initial inertia, assisting in crankshaft rotation, aiding compression stroke, and ignition facilitation. Hence, operator expose to the starting air system will have a risk of high-pressure hazards.
  9. Generator damage: If the GEG connected to the generator and connected to the grid (parallel mode), malfunction of GEG will result to unable to drive the crank shaft and cause of reverse power to generator.

General problem Gas Engine Generator (GEG) and possible causes

Engine does not crank.

  • Failure of starter solenoid;
  • DC battery dead; and
  • Water filled cylinder

Engine does not start.

  • Fuel starvation;
  • Air leak in to fuel system; and
  • Fouled spark plug.

Engine hunts.

  • Air leaks into fuel system;
  • Loss of fuel supply; and
  • Low octane fuel.

Engine misfires or backfires.

  • Low octane fuel;
  • Less pressure of fuel supply;
  • Less of air intake i.e. dirty air intake screen; and
  • Exhaust gaseous restriction.

Engine overheats

  • Loss of coolant flow;
  • Coolant pump belt loose/broken; and
  • Faulty of pump impeller

Compressor surging

  • Turbine wheel heavily fouled;
  • Foreign material in turbine or in compressor;
  • Low air inlet temperature (higher air density);
  • Exhaust gas backpressure after turbine too high.

Compressed air pressure too low

  • Silencer or air filter fouled;
  • Compressor fouled;
  • Turbine wheel heavily fouled;
  • Rotor rubbing;
  • Foreign material in turbine or in compressor;
  • High air inlet temperature (low gas density);
  • Exhaust gas backpressure after turbine too high.

Compressed air pressure too high

  • Low air inlet temperature (high gas density)

Turbocharger speed too low

  • Silencer or air filter fouled;
  • Compressor fouled;
  • Turbine wheel heavily fouled;
  • Defective bearing, imbalance of the rotor; and
  • High air inlet temperature (low gas density)

Turbocharger speed too high (over-boosting)

  • More fueling;
  • Low air inlet temperature (high gas density, high momentum)