Fault Tree Analysis (FTA) is a systematic and graphical method used for analyzing the cause of a system failure and system reliability. In the Fault Tree Analysis, a top event or system failure is identified, and the possible contributing factors and events leading to that failure are systematically analyzed and represented in a tree-like diagram.

The diagram consists of logical gates (AND, OR, and NOT) and events that contributed to the top event. The event vents are connected in a way that presents the relationships between particular part and their impact on the overall system failure.
The main components of a Fault Tree include:
- Top Event: The undesired event or system failure that is being analyzed such as failure of control function, failure of safety instrumented function, equipment failure, or etc.
- Basic Event: The lowest level events in the tree that cannot be broken down further. These events are considered as cause of the top event.
- Logical Gates: Below are typical gates that are used in Fault Tree Analysis (FTA)
| Gate Type | Interpretation |
| AND | Events that must occur together for the next event to occur |
| OR | Events where any one or more can cause the next event to occur |
Advantages and Disadvantages
The Advantages of Fault Tree Analysis are the following;
- Systematic Approach: FTA provides a systematic and structured approach to analyzing the cause of system failures.
- Visual Representation: FTA provides a visual representation of the potential failure modes and their relationships which allows for the identification of critical paths and weak points in a system, helping organizations prioritize resources for risk mitigation.
- Decision Support: FTA is an effective tool for the Route Couse Analysis (RCA) and Common Cause Analysis (CCA) studies by breaking down a complex system into its basic events.
The disadvantages of Fault Tree Analysis are the following;
- Simplicity Assumption: FTA relies on certain assumptions, such as each basic event is independent. In reality, events may be correlated.
- Data Requirement: FTA requires quantitative data for probabilities and failure rates. Obtaining accurate and reliable data can be challenging, especially for rare events.
- Complexity: For the complex system. FTA can become very intricate and difficult to manage as the number of events and branches increases.
- Dynamic Situation: FTA is primarily a static analysis tool, and it may not capture the dynamic nature of the interactions and dependencies of some events that may change over time such as frequency maintenance can be subject to reduce equipment failure.
- Subjectivity: The process of assigning probability value to events in FTA can be varied by different analysts.
Comparison
If comparing the Fault Tree Analysis (FTA) method with the other reliability study method, the results can be presented as the following.
| Study | Focus |
| Event Tree Analysis (ETA) | Analyze the consequences rather than probability as the FTA does. |
| Failure Mode and Effect Analysis (FMEA) | FMEA is often used for more detailed analysis and qualitatively focuses on the component’s failure modes and their effects. |
| Makov | Makov can provide an advance in a dynamic situation since it focuses on the probabilities of transitioning between different states of a system over time |
| Reliability Block Diagram (RBD) | RBD is often used for less complex. |
| Monte Carlo | Monte Carlo incorporates the probabilistic inputs and variation, providing a more realistic. |
| Bayesian Network | Bayesian networks can model probabilistic dependencies among a set of variables which can provide more flexibility in handling complex relationships. |
Calculation
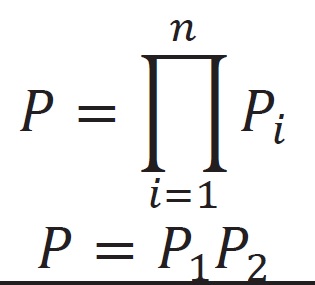
For events connected by an AND gate, the overall probability is calculated using the multiply function from individual probabilities.
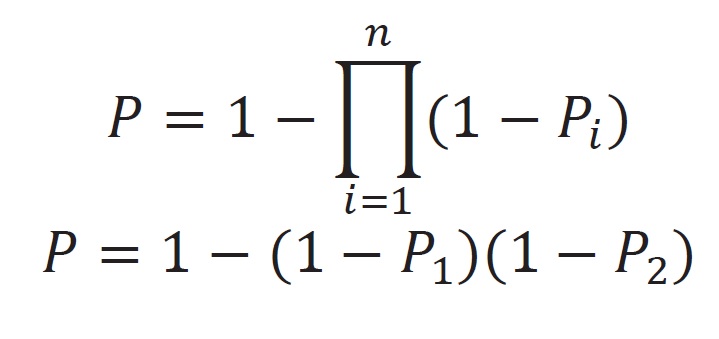
For events connected by an OR gate, the overall probability is calculated using the complement rule. The complement of the event not occurring is subtracted from 1.
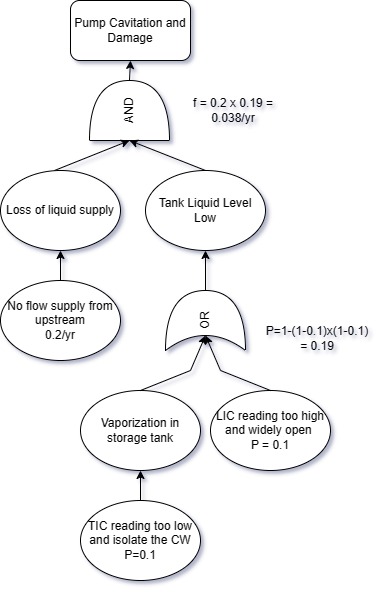
Example
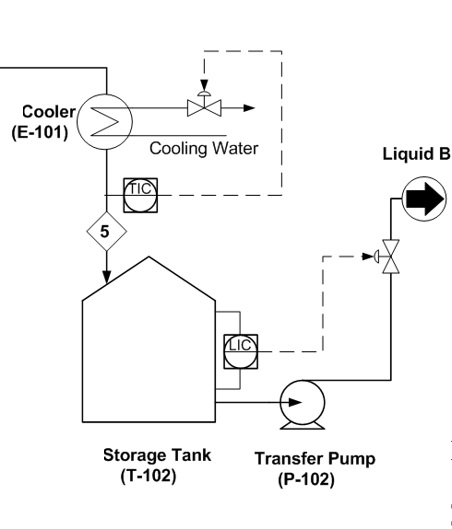
To analyze the frequency of flammable hydrocarbon pump cavitation and damages by loss of the liquid supply from the upstream process is approximately 0.2/year and the probability of malfunction of BPCS control loops such as cooldown temperature control loop (TIC) and storage tank level control loop (LIC) is 0.1.
To draw the FTA diagram, we will use the Top-Down technique.